
The National Energy System Operator (“NESO”) has published its Winter Outlook for 2026/27, offering what appears to be a reassuring assessment of Britain’s electricity security. It expects enough generating capacity or imports to meet demand, with a de-rated capacity margin of 5.9 GW, equivalent to 9.5% of average cold spell peak demand, and a loss of load expectation (“LOLE”) below 0.1 hours per year.
That’s comfortably within the Government’s reliability standard of three hours per year, and only slightly lower than last winter’s spare margin of 6.1 GW.
Unfortunately it looks more like wishful thinking than a serious analysis of the true security risks this winter. Given NESO’s own engineers struggle to confirm whether the largest loss was covered on 23 June either in real time or subsequently, we’re entitled to take this analysis with a large dose of scepticism. NESO has changed the way it calculates the contribution of wind generation, increasing the amount of firm capacity attributed to the wind fleet. Its assessment also assumes significant electricity imports during periods of system stress, including from Ireland, a market which is normally dependent on imports from Great Britain.
Adjusting for the change in methodology and removing the assumed Irish contribution produces a far smaller margin of around 0.5 GW.
Methodology change flatters the margin
The first issue is the comparison with last winter. NESO’s published figures suggest that the de-rated margin has fallen only slightly, from 6.1 GW in winter 2025/26 to 5.9 GW this winter, a reduction of just 200 MW. But NESO has introduced a new methodology for calculating the relationship between electricity demand and wind generation – previously, it modelled demand and wind separately, applying an adjustment to account for the tendency for wind output to be lower during cold, high-pressure weather associated with high electricity demand.
The new methodology instead uses paired historical half-hourly observations, subtracting wind generation from demand in the same periods. NESO argues that this better captures the observed relationship between the two.
There is nothing inherently wrong with using paired observations, and NESO absolutely needs to take account of the fact that low wind conditions are often associated with cold weather, so if the purpose of the exercise is to measure the generation available to meet Average Cold Spell (“ACS”) demand, this is important. The problem is this change produces a far better result, suggesting a higher wind contribution that the previous method did. That offends the principle of conservatism that should underpin winter margin calculations particularly when without it, the margin would be much lower than last year.
In Appendix D of its Winter Outlook, NESO provides the margin calculated using its previous methodology: 5.2 GW, or 8.4% of average cold spell peak demand, and almost 1 GW (15%) lower than last year. NESO acknowledges that the methodology has changed and provides the alternative calculation while emphasising the apparent stability of the headline margin. That’s pretty misleading in my opinion. A comparison based on different methodologies buried in an appendix is a weak foundation for reassuring readers that electricity security has barely changed.
How much can Britain really rely on wind?
The second issue is what contribution wind generation actually does make. Britain has installed a large amount of wind capacity, but installed capacity and firm capacity are very different things. Wind generation supply a lot over the course of a winter, but the point of the winter margin analysis is to assess the generation to meet ACS demand, not what happens on average. And cold days are often still.
I analysed half-hourly demand and wind generation data from the NESO Portal covering eight winters, from 2018/19 to 2025/26, to illustrate why this distinction is important. There have been repeated occasions when demand was high and wind output was extremely low. For example, on 24 January 2019, a period of around 13 hours coincided with high demand with wind output averaging only around 3.6% of estimated installed capacity. That would almost wipe out the spare margin NESO now claims.
On 12 December 2022, a similar episode lasted approximately 13.5 hours, with average wind output of around 6.6% of capacity. Other significant episodes occurred in December 2021, December 2023 and January 2025. These aren’t always the longest periods of low wind, but they coincided with particularly demanding conditions for the electricity system.
NESO’s capacity workbook attributes around 5.5 GW of de-rated capacity to wind, against installed wind capacity of roughly 33.4 GW in its assessment. The resulting capacity credit is far below wind’s average winter load factor, but is still a significant contributor to the headline margin.
My historical analysis doesn’t show that NESO’s equivalent firm capacity calculation is wrong – calculating EFC properly requires a probabilistic assessment of the whole electricity system, including the coincidence of wind output, demand, conventional plant outages and other available resources, and NESO’s supporting documentation don’t provide enough data to do this even if I had access to the model.
However, the analysis demonstrates why NESO needs to show that its higher wind contribution remains robust under prolonged, geographically widespread low-wind conditions. The new model uses 17 historical weather years, from 2005 to 2022 – more than is available on the NESO Portal for wind. Historical observations are valuable, but the number of genuinely severe, system-wide scarcity events within that period is limited.
I analysed metered transmission-connected wind generation against transmission system demand, which already reflects the demand-reducing effect of embedded wind. For the load-factor calculations, I added estimated embedded wind generation to transmission-connected output and compared the total with estimated installed wind capacity.
Using NESO’s published generation and demand data from 2018/19 to 2025/26, I combined transmission-connected and embedded wind output and divided it by estimated installed capacity and interpolated between annual year-end figures, to calculate actual wind load factors. I then looked at wind performance during the 1%, 5% and 10% of half-hours with the highest transmission system demand, as well as periods of highest residual demand, when the system was most dependent on other sources of generation.

The results show that wind load factors were lower during the highest-demand decile than the winter average in all eight years, while average load factors during the highest 10% of residual-demand periods ranged from just 14.6% to 26.7%. I also identified repeated episodes of high demand lasting several hours when wind output was below 10% of installed capacity.
Another really big omission from NESO’s analysis is grid constraints. NESO models wind speeds at individual wind farm locations and infers generation, but explicitly excludes regional transmission constraints from its winter margin calculations. This might be reasonable for a narrowly defined assessment of national resource adequacy, but the Winter Outlook is a public communication intended to reassure consumers about security of supply.
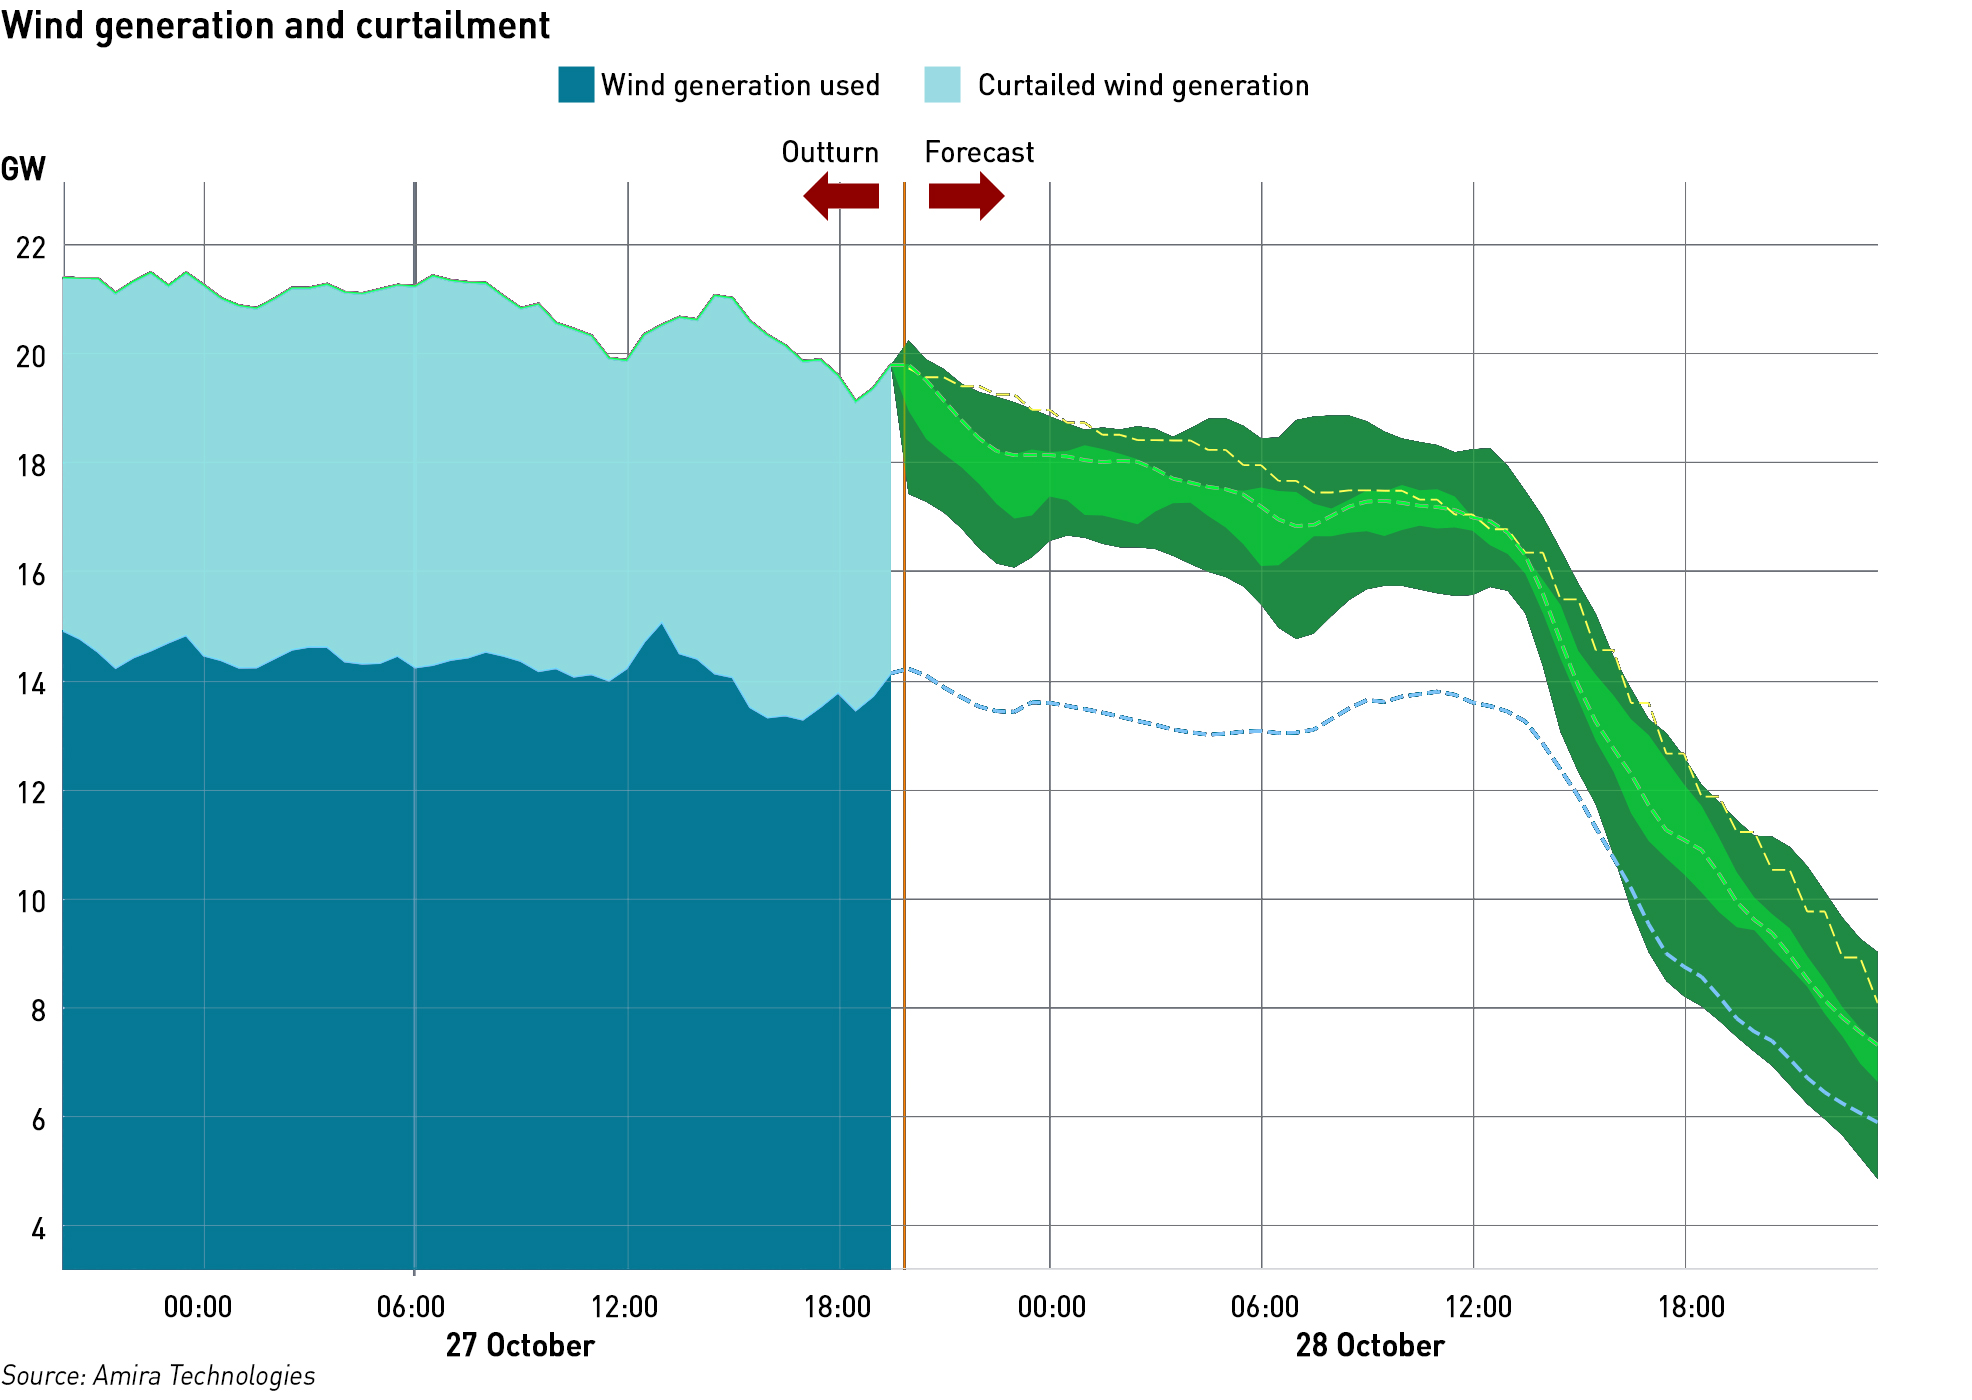
What matters to consumers isn’t how much electricity could theoretically be generated, but how much can actually be delivered to them. Today is a very good example of this difference with around a third of wind generation being curtailed off due to grid constraints. A spare capacity margin that ignores transmission constraints risks overstating the resilience of the electricity system, particularly when significant amounts of wind generation are located behind constrained boundaries.
The question isn’t whether NESO’s new methodology is more elegant than the old one, it’s whether the higher wind capacity credit is justified at the extremes of the probability distribution, where security-of-supply risks are concentrated.
Can Britain really rely on electricity imports?
The third issue concerns interconnectors. NESO’s assessment includes 10.3 GW of interconnector capacity, which it de-rates to 6.6 GW. That’s a significant contribution, and larger than its entire capacity margin.
Interconnectors can improve security of supply by allowing electricity to flow from markets with spare generation to markets experiencing shortages. However, those flows depend on electricity actually being available in the neighbouring countries and on the commercial and operational conditions governing cross-border flows. During widespread cold, low-wind weather, neighbouring countries might be experiencing similar problems, as they did this summer when the heatwaves covered a very large part of Europe and was associated with extensive low wind output.
NESO recognises that electricity flows are driven by market prices and that imports can be affected by conditions in interconnected markets, but its technical methodology assumes that interconnectors contribute in line with their Capacity Market de-rating factors during periods of stress. The Capacity Market test for interconnector availability is that the cables are capable of flowing, not that they are importing to GB – there is no mechanism whatsoever for NESO to compel imports to Britain from other countries. It can cut of exports as it did to the Netherlands on 23 June, but under no circumstances can it compel imports.
The other obvious issue with NESO’s approach is that it includes the Irish interconnectors. Britain has three electricity interconnectors with the island of Ireland: Moyle, East West and Greenlink, each rated at 500 MW. These links almost always carry electricity from Britain to Ireland, rather than the other way around – in fact reverse flows are rare and typically in the 10s of MW.
NESO expects GB to export to Ireland and Northern Ireland under typical conditions – in its operational surplus modelling it assumes 1 GW of exports to Ireland. Yet its capacity adequacy assessment assigns a positive import contribution to the Irish interconnectors during system stress. While electricity flows can reverse when market conditions change, and an interconnector that normally exports could theoretically import during a shortage, how likely is it in practice?
The assumption is hard to justify when the neighbouring system is structurally dependent on imports and faces many of the same weather-related risks that we do. Ireland and GB can experience simultaneous low-wind conditions, and if both systems are short of electricity, it’s difficult to see why Britain should expect significant exports from Ireland. Not least because Ireland is structurally dependent on GB and behaves more like a demand region just like SE England, Wales, and any other part of GB than an independent market.
For my alternative calculation, I excluded the Irish interconnectors altogether.
The published 2026/27 Capacity Market factors for Moyle and East West are 54%, implying a contribution of 270 MW from each link. Using 54% as an estimate for Greenlink produces a combined Irish capacity credit of approximately 810 MW. Removing these reduces NESO’s headline margin from 5.9 GW to approximately 5.1 GW.
This is also a conservative sensitivity rather than a recalculation of the probability that Ireland could export during British scarcity, which would involve detailed modelling of the two electricity systems together. Nevertheless, a zero-import assumption is a reasonable test of Britain’s ability to meet demand without depending on a neighbouring market that normally relies on British electricity.
What does the adjusted margin look like?
To illustrate the potential risks in NESO’s assumptions, I calculated an alternative winter capacity margin using more conservative estimates for wind generation and electricity imports. I reduced wind’s assumed firm capacity contribution from 16.5% to 10% of installed utility-scale capacity and halved the 6.6 GW contribution attributed to interconnectors, removing the Irish interconnectors and reflecting the risk that neighbouring countries may be unable or unwilling to export electricity during periods of simultaneous scarcity. On this basis, NESO’s reported spare margin of 5.9 GW falls to just 0.5 GW, before allowing for transmission constraints that could prevent electricity reaching consumers.
The combined effect of these adjustments is significant:
NESO baseline margin: 5.90 GW
Wind EFC reduced to 12% for utility-scale wind: 4.42 GW
Wind EFC reduced to 10% for utility-scale wind: 3.76 GW
Interconnector contribution reduced by 25%: 4.25 GW
Interconnector contribution reduced by 50%: 2.61 GW
Wind EFC 10% and interconnector contribution reduced by 50%: 0.47 GW
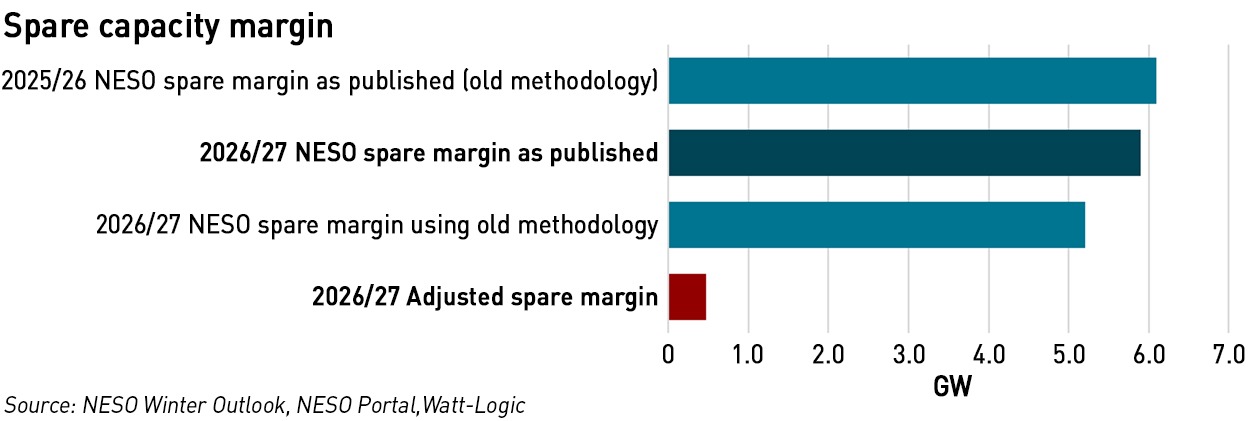
This is an illustrative stress scenario, not a probabilistic forecast, but it demonstrates how sensitive the headline margin is to assumptions about weather-dependent generation and imports. A conservative approach to assessing winter electricity security is essential because the consequences of overestimating available capacity are far more serious than those of underestimating it.
An overly cautious assessment might lead to additional reserve procurement and some extra cost, whereas an optimistic assessment could leave the system inadequately prepared for shortages, with potentially severe economic and societal consequences. Given these asymmetric risks, security of supply assessments should place particular emphasis on credible adverse conditions rather than relying principally on central assumptions that might not hold when the system is under stress.
Is NESO too confident?
Not only is NESO’s Winter Outlook worrying in its optimism, it’s also worrying in its level of reassurance. NESO states that margins are expected to be adequate, broadly comparable with recent winters and within the reliability standard. It also reports that all its published downside sensitivities remain within that standard, including scenarios with materially reduced conventional generation or interconnector imports.
The technical documents acknowledge certain limitations in that NESO recognises some uncertainties can’t be represented probabilistically with the same confidence as risks for which historical data are available. These include rare or unprecedented events, geopolitical shocks, disruption to energy imports and other developments that may fall outside historical experience. But this raises questions about the strength of the conclusions drawn from the model.
A LOLE below 0.1 hours per year is a modelled expectation conditional on the assumptions and probability distributions used. The 90% confidence ranges shown for operational surpluses describe outcomes within NESO’s chosen modelling framework – they should not be interpreted as 90% confidence that the system is secure against risks the framework cannot adequately quantify.
This is particularly relevant when the electricity system is increasingly exposed to correlated risks. Low wind output can affect several countries simultaneously. Interconnector flows might be constrained by shortages or political decisions in neighbouring markets. Storage might run out during extended periods of scarcity. These aren’t necessarily independent risks – they could materialise together.
The Winter Outlook’s individual downside sensitivities are helpful, but they don’t establish how the system would perform under all plausible combinations of adverse circumstances.
NESO is entitled to identify its central forecast as its best estimate, but should be more cautious about allowing its central estimate to become a broader statement of confidence in electricity security. The presentation would be more informative if it gave greater prominence to the old-methodology comparison, disclosed the sensitivity of wind’s firm capacity contribution to extreme weather selection, and separately examined the impact of receiving no imports from Ireland.
It would also be useful to see a combined downside scenario involving prolonged low wind, reduced interconnector imports and unexpected conventional generation outages.
Data integrity
Interestingly, when I compared the wind generation data published on the NESO Portal with the equivalent data from BMRS (Elexon’s Balancing Mechanism Reporting Service), which is the system of record for electricity market data, I found discrepancies. While the figures agree closely for most winters, there are some large differences in 2021/22 and 2022/23.
In 2022/23, BMRS reports average wind generation approximately 1.9 GW higher than the Portal, increasing the calculated winter load factor from 32.7% to 39.5%. The differences extend across thousands of half-hourly observations, suggesting a systematic inconsistency rather than isolated errors. There are also smaller discrepancies in the demand data, while BMRS itself contains some anomalous readings.
The reasons for these differences aren’t clear, but they raise questions about the reliability and consistency of the historical datasets used to assess electricity security. Repeating the analysis using BMRS data doesn’t change the key finding that wind output is consistently lower during periods of highest electricity demand, and particularly low when residual demand is greatest. NESO should explain these discrepancies and clarify which historical data underpin its new wind capacity calculations.
.
NESO repeats assurances that the grid is secure like a tired mantra, yet its CEO, Fintan Slye admitted that he was aware of engineer concerns that the grid is not secure before the recent Eversheds report highlighted them. Eversheds identified four main underlying issues:
- high levels of operational stress
- a significant disconnect between the [control room] and executive leadership
- a culture of reputational sensitivity affecting the perception of operational independence, and
- a gap between formal [whistleblowing] commitments and the lived experience of staff
Engineers disagree on whether the largest loss was covered on 23 June, which is shocking as it suggests that NESO lacks the systems to know in real time what the spare margin was and is unable to calculate it retrospectively. That is a huge concern as we move into winter when margins are generally tighter.
“There’s nothing in any of those four themes that was a huge surprise, or that I could put my hand on my heart and say that I haven’t heard that from someone in the organisation,”
– Fintan Slye, CEO of NESO
It’s clear, and Slye admitted as much, that “other priorities” such as the drive to Clean Power 2030 and Net Zero 2050 have diverted attention and resources away from the fundamentals of security of supply. An important step in correcting this failure would be to stop issuing platitudes and start communicating with greater honesty and transparency the true strength of the grid.
In terms of the Winter Outlook this means presenting more rigorous scenario analyses that set out the risks, recognising that risks might coincide.



I believe emergency procedures require the continental grid operators to restrict cross-border capacity if their own system is at risk. If NESO’s predictions depend on unrestricted imports they are delusional.
Apparently the German army was prevented in 1940/41 from taking Moscow due to one of the coldest winters on record because of a polar collapse resulting from one of the strongest el ninos on record. And this year it is much stronger! I think maybe we are in Trouble! (From AI.. The exceptionally cold European winter of 1940–1941—part of a rare three-winter streak of brutal cold during World War II—was directly linked to one of the most prolonged and powerful El Niño events of the 20th century. It produced conditions that fit the modern energy definition of a cold Dunkelflaute).
Sounds like we’re not actually covered for an unexpected widespread period of very cold still weather – say several days across most of Western Europe. Or do we assume demand will fall under these conditions?
Excellent analysis. I’m just wondering what will happen if the department for net zero goes ahead and fits CCS units to existing gas stations, reducing their generating efficiency substantially.
This means that baseload will reduce and make electricity more expensive.
Apparently one power station fitted with CCS reduced CO2 emissions by just 0.007%. So what’s the point?
It’s just hubris
While they are allegedly bedding down their transition, you would expect them to have a close eye on anything which may go wrong. They real danger time is in a few years when they get (over)confident that their system is operating satisfactorily.
“ I analysed half-hourly demand and wind generation data from the NESO Portal covering eight winters, from 2018/19 to 2025/26 …”
Ah, missing the entire week in Jan 2017, during which our entire fleet of wind turbines generated at less than 10% Capacity Factor.
https://i.postimg.cc/Y2QbG70Z/IMG-3662.jpg
Very similar themes to the investigation of ERCOT after the Great Freeze of 2021. Misdirection and data not aligning with narrative is rampant. 6GW reserves on a 45GW demand is only 7.5% and that counts on imports. ERCOT has 20% larger peak demand and carries ~18% planning reserve number without imports obviously. The Public Utility Commission of Texas (PUCT) and ERCOT Board of Directors set a minimum target planning reserve margin of 13.75%. NESO sounds like they are skating on thin ice.
They would do well to follow the lead of NYSIO-2024 Power Trends Annual report and put text in reports that say things like, “Policy based closures of dispatchable generation are not being replaced by dispatchable emission free resources and such resources are not available in commercial quantities. Some demand scenarios show failure to meet demand starting in 20XX without such resources.” NY started issuing exceptions and undoing a lot climate zealotry after that. Other ISO’s have used similar language to motivate politicians to invoke at least a tiny amount of common sense.