
Over the past few months we have been inundated with claims from interested parties that more renewables are the (only) solution to the energy crisis. They also claim that renewable energy is cheap, deflationary, and will deliver lower bills to consumers. They tend to ignore questions about managing intermittency and the cost of back-up, pointing to “studies” that show a near-100% renewables energy system is “possible”. Some are actually quite rude when challenged on the subject (I have been invited to educate myself and told I may as well work in a shop, which seems offensive both to me and to retail workers…). In this post I will explore the actual cost of renewable generation for consumers. Anyone who finds actual data inconvenient or offensive should look away now…
Setting the scene
I think it is important to remember what we had before we began the energy transition. In Britain, we were just finishing the decade-long process of privatising and un-bundling the electricity market. At the turn of the century, we had an electricity system that was heavily fossil-fuel dominated, and arguably over-supplied as a result of the “dash for gas”. The decade since 1990 had seen electricity bills falling, so privatisation was largely seen as a success. Electricity was generated in large power stations connected to the high voltage grid, and demand was for the most part passive. Balancing supply and demand in real time was relatively simple – demand fluctuated based on the weather in largely predictable ways and output could be dispatched to match. Capacity margins were healthy, and blackouts were only thought of in the context of industrial action (memories of the 1970s being still fresh) or acts of God such as lightning hitting key infrastructure.
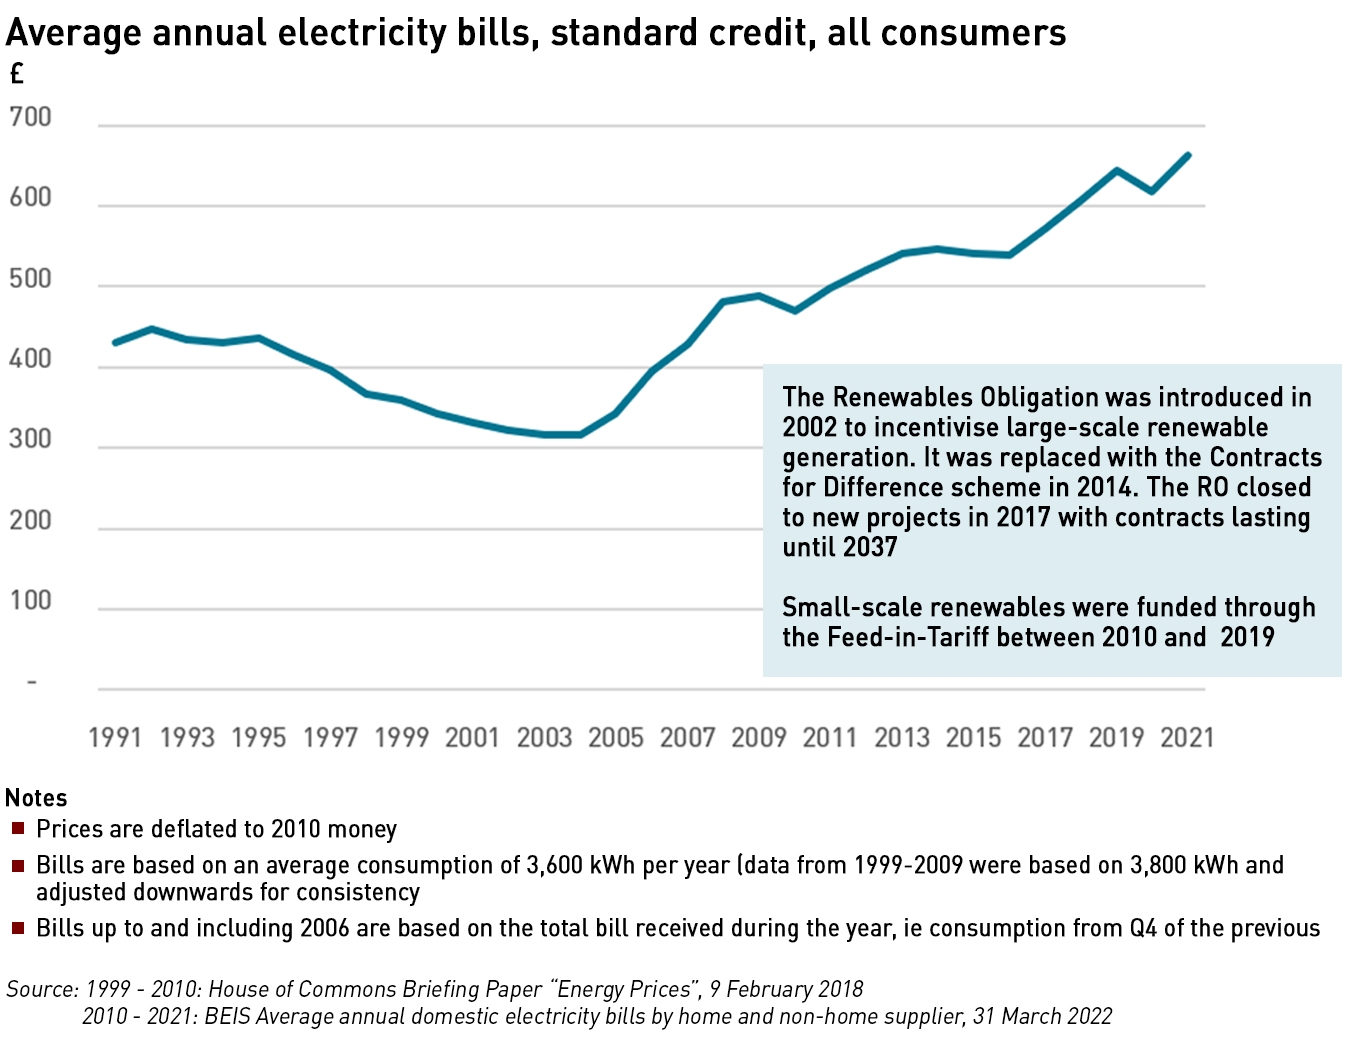
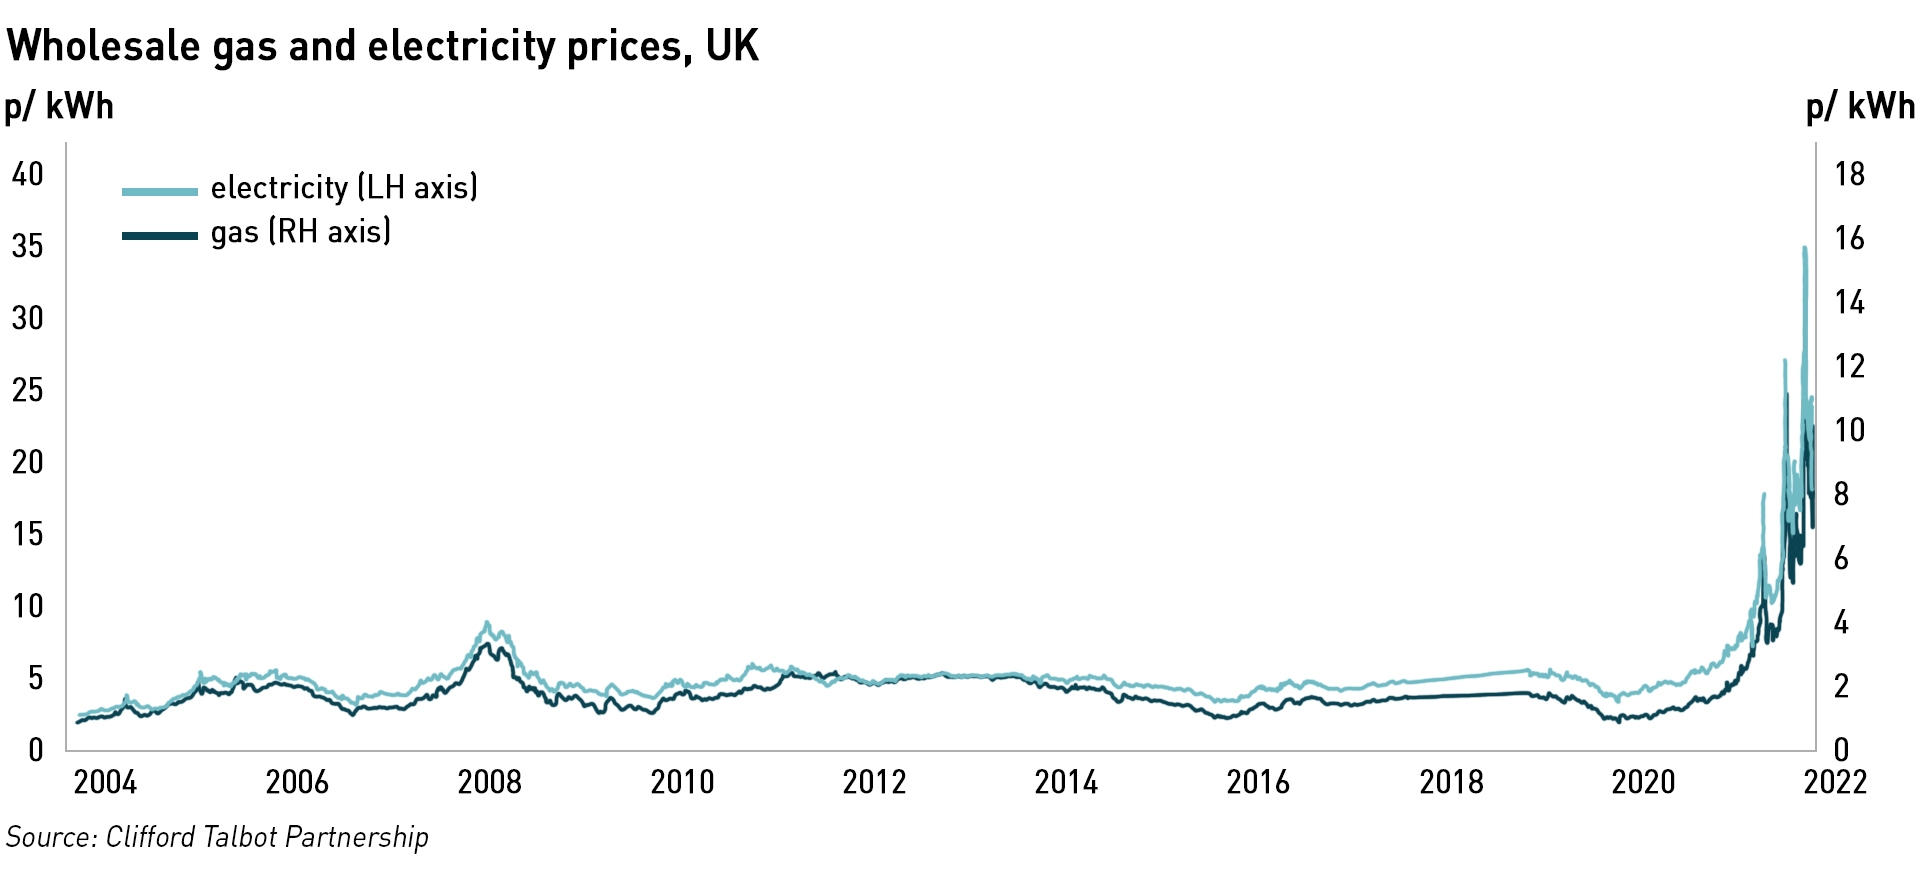
The beginning of this century saw two major changes: the first was the final separation of the “last mile” of the electricity market with the creation of suppliers and their separation from network companies under the Utilities Act 2000. Now consumers had proper choice over from whom to buy their energy. The second major change was the introduction of the Climate Change Levy in 2001 and the Renewables Obligations in 2002 (yes, it is now 20 years since we started subsidising off-shore windfarms). The years since these changes have seen end user electricity costs rise steadily, while wholesale prices have shown no such trend.
Costs of renewables are (not) falling
“Renewables” is a broad church, and in some respects the costs have been falling. Small-scale solar schemes are no longer eligible for subsidies in Britain, but they continue to be built, albeit at a slower rate. Most new solar projects are large-scale, and overall 1 GW of new capacity has been added since the subsidy schemes ended. However, costs have been rising in the past couple of years due to supply chain issues.
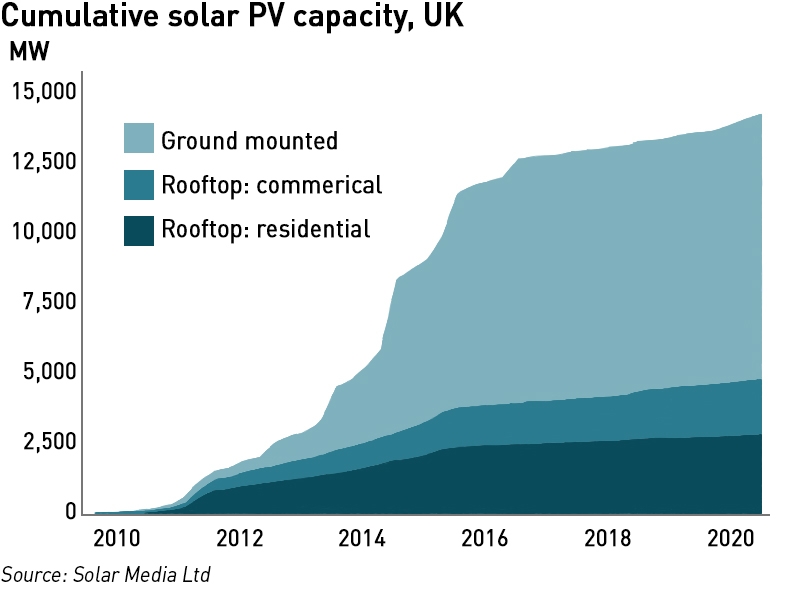 This illustrates the difficulty of the falling costs narrative: as technologies mature, the experience curve dictates that costs will fall, but they are not immune to global supply and demand dynamics. As technology costs fall, demand might increase, and if supply cannot keep up, then prices will rise, irrespective of any gains from the experience curve. This has certainly been seen in the case of solar panels, with constraints in the polysilicon supply chain (setting aside the ethical issues of buying materials tainted by claims of forced labour use).
Renewables advocates point to declining Contracts for Difference (“CfD”) strike prices as evidence the costs of renewables are falling. It is certainly a fact that CfD prices have been falling, but it is less easy to understand why. It is also reasonable to question why, after 20 years, subsidies are still required – 20 years should be long enough for a technology to mature to a level where subsidies are not needed, so perhaps the need for CfDs at all for technologies such as off-shore wind should be scrutinised.
I have previously referenced the work of Professor Gordon Hughes at the University of Edinburgh which shows that the capex and opex costs of offshore wind are not falling, contrary to the popular narrative that they are. I have also validated his work with my own research – most large UK wind projects are incorporated as SPVs and as such their accounts are publicly available at Companies House. These accounts show, for anyone with the patience to go through them, that the much vaunted price reductions are not happening in practice.
“The actual costs of onshore and offshore wind generation have not fallen significantly over the last two decades and there is little prospect that they will fall significantly in the next five or even ten years… Far from falling, the actual capital costs per MW of capacity to build new wind farms increased substantially from 2002 to about 2015 and have, at best, remained constant since then…the operating costs per MW of new capacity have increased significantly for both onshore and offshore wind farms over the last two decades,”
– Professor Gordon Hughes, University of Edinburgh
It is difficult to square this with falling CfD auction prices, but the CfD only needs to support cashflows for debt repayment – it is likely that once the subsidies expire many schemes will be uneconomic unless high power prices persist, which undermines the “renewables provide low cost energy” arguments.
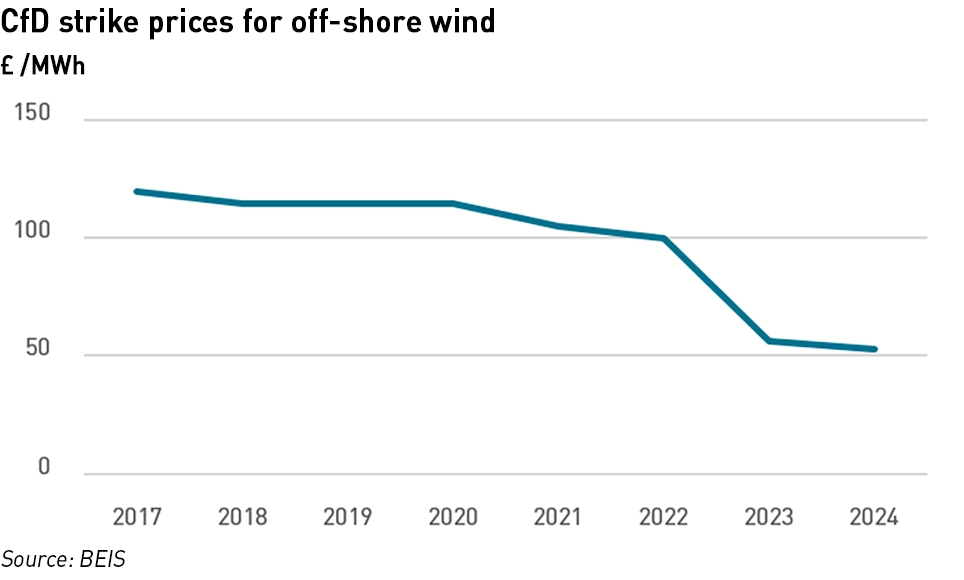
Hughes postulates that three factors may explain falling CfD prices: the dominance of large, often state-controlled companies in the off-shore wind sector that can deploy large cash flows from existing businesses, and which are under little pressure to return cash to either customers or shareholders; the operators may expect to be able to sell a large portion of their shares in the projects to over-optimistic investors while projects also rely heavily on debt provided by equally naïve lenders; and operators / financial investors may expect to be bailed out, since once the financial consequences of the underlying economics become undeniable there will be pressure to pass the full costs of these projects to either electricity consumers or taxpayers.
I’m doubtful that operators or investors are thinking that deeply…I suspect that as long as they can get deals done they are happy to buy into the falling costs narrative, particularly since the day of reckoning when the subsidy schemes expire is 15 years away at which point the individuals concerned will most likely have moved on.
In fact there is now a consensus that rising prices of materials such as steel and copper will have to be passed on to customers, driven in part by the war in Ukraine, so all new infrastructure investments including renewable generation will be subject to higher costs and possible supply chain disruptions. This may well change bidding behaviour in future CfD auctions, reversing the downwards trend, while some energy companies have already booked impairments on renewables projects under construction.
Renewables do not provide cheap electricity
Renewables supporters also claim that the energy they provide is cheap, an argument which has widespread appeal since it is clear to everyone that wind and sunshine are free. Unfortunately, this fact isn’t that relevant when considering the cost of renewable generation, because what matters is the cost of reliable electricity which includes the electricity that has to be provided when it isn’t windy or sunny.
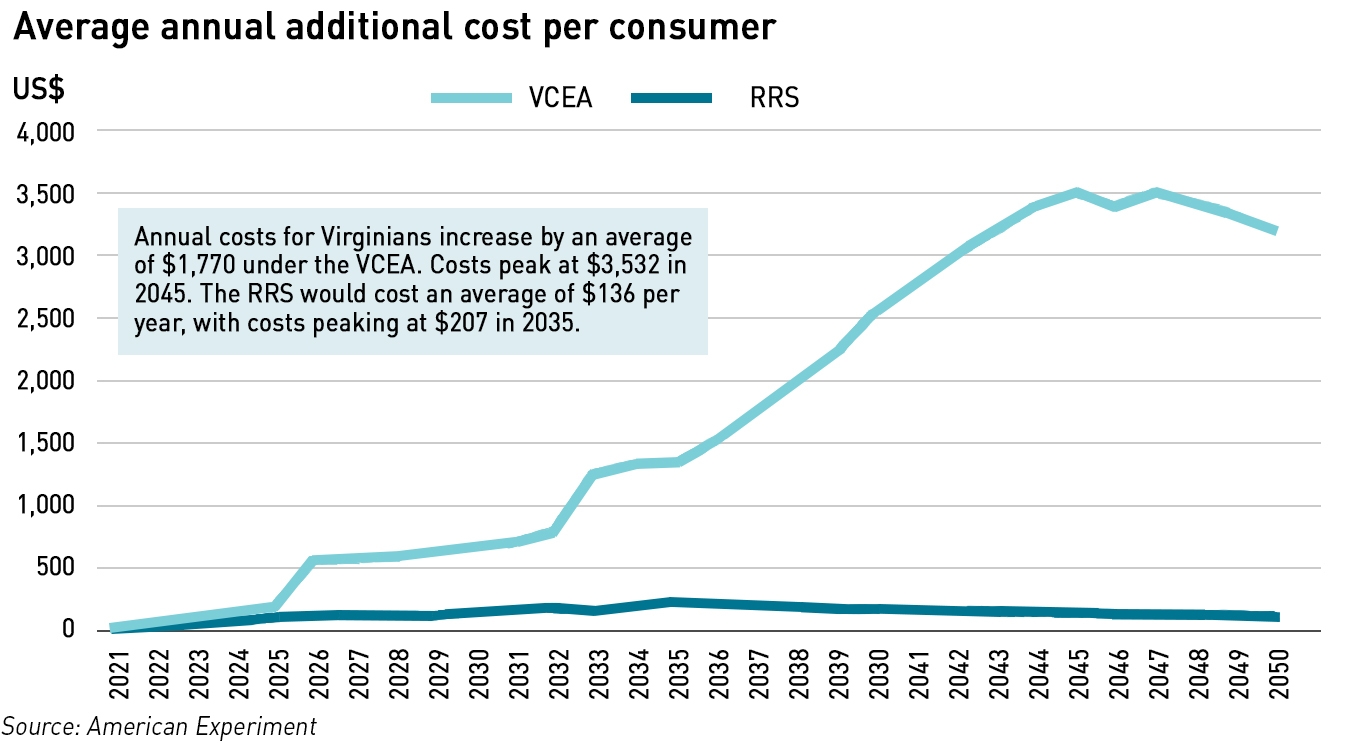
This study published in February by US-based think tank American Experiment highlights to costs of renewable generation to end users. This study assesses how the Virginia Clean Economy Act (“VCEA”) would increase costs for consumers and make the grid more fragile. It also assesses an alternative scenario, the Reliable Resource Scenario (“RRS”), where reliability and affordability are prioritised.
“Offshore wind dramatically increases the cost of providing the electricity Virginians rely upon. This energy source will cost $154 per megawatt-hour (MWh) when the often-hidden transmission costs, property taxes, utility returns, and battery storage costs are accounted for. The VCEA will reduce the reliability of the grid by making the state more reliant upon weather-dependent energy sources like wind and solar, and energy imports from other states. This is the same strategy California has pursued, with unenviable results.”
The VCEA proposal would see an electricity mix free from fossil fuels by 2050, with around 30% of electricity coming from nuclear and hydro, 15% from imports and the rest from intermittent renewables and batteries. The RRS alternative has a similar amount of nuclear, hydro and imports, but has half of electricity coming from natural gas.
The conclusions are not specific to Virginia, they are generically true for all markets where fossil fuel based generation is being displaced by subsidised intermittent renewables. The study points out that the LCOE (Levelised Cost of Energy, which reflects the cost of generating electricity from different types of power plants, on a per-unit of electricity basis over an assumed lifetime and quantity of electricity generated by the plant) for renewables is higher than for fossil fuel generation once the costs of backing-up their intermittency is included, something many analyses including the ones used by BEIS, fail to include. Cost comparisons should reflect the costs of delivering reliable electricity to end users, ie the cost to meet demand, so ignoring intermittency invalidates these 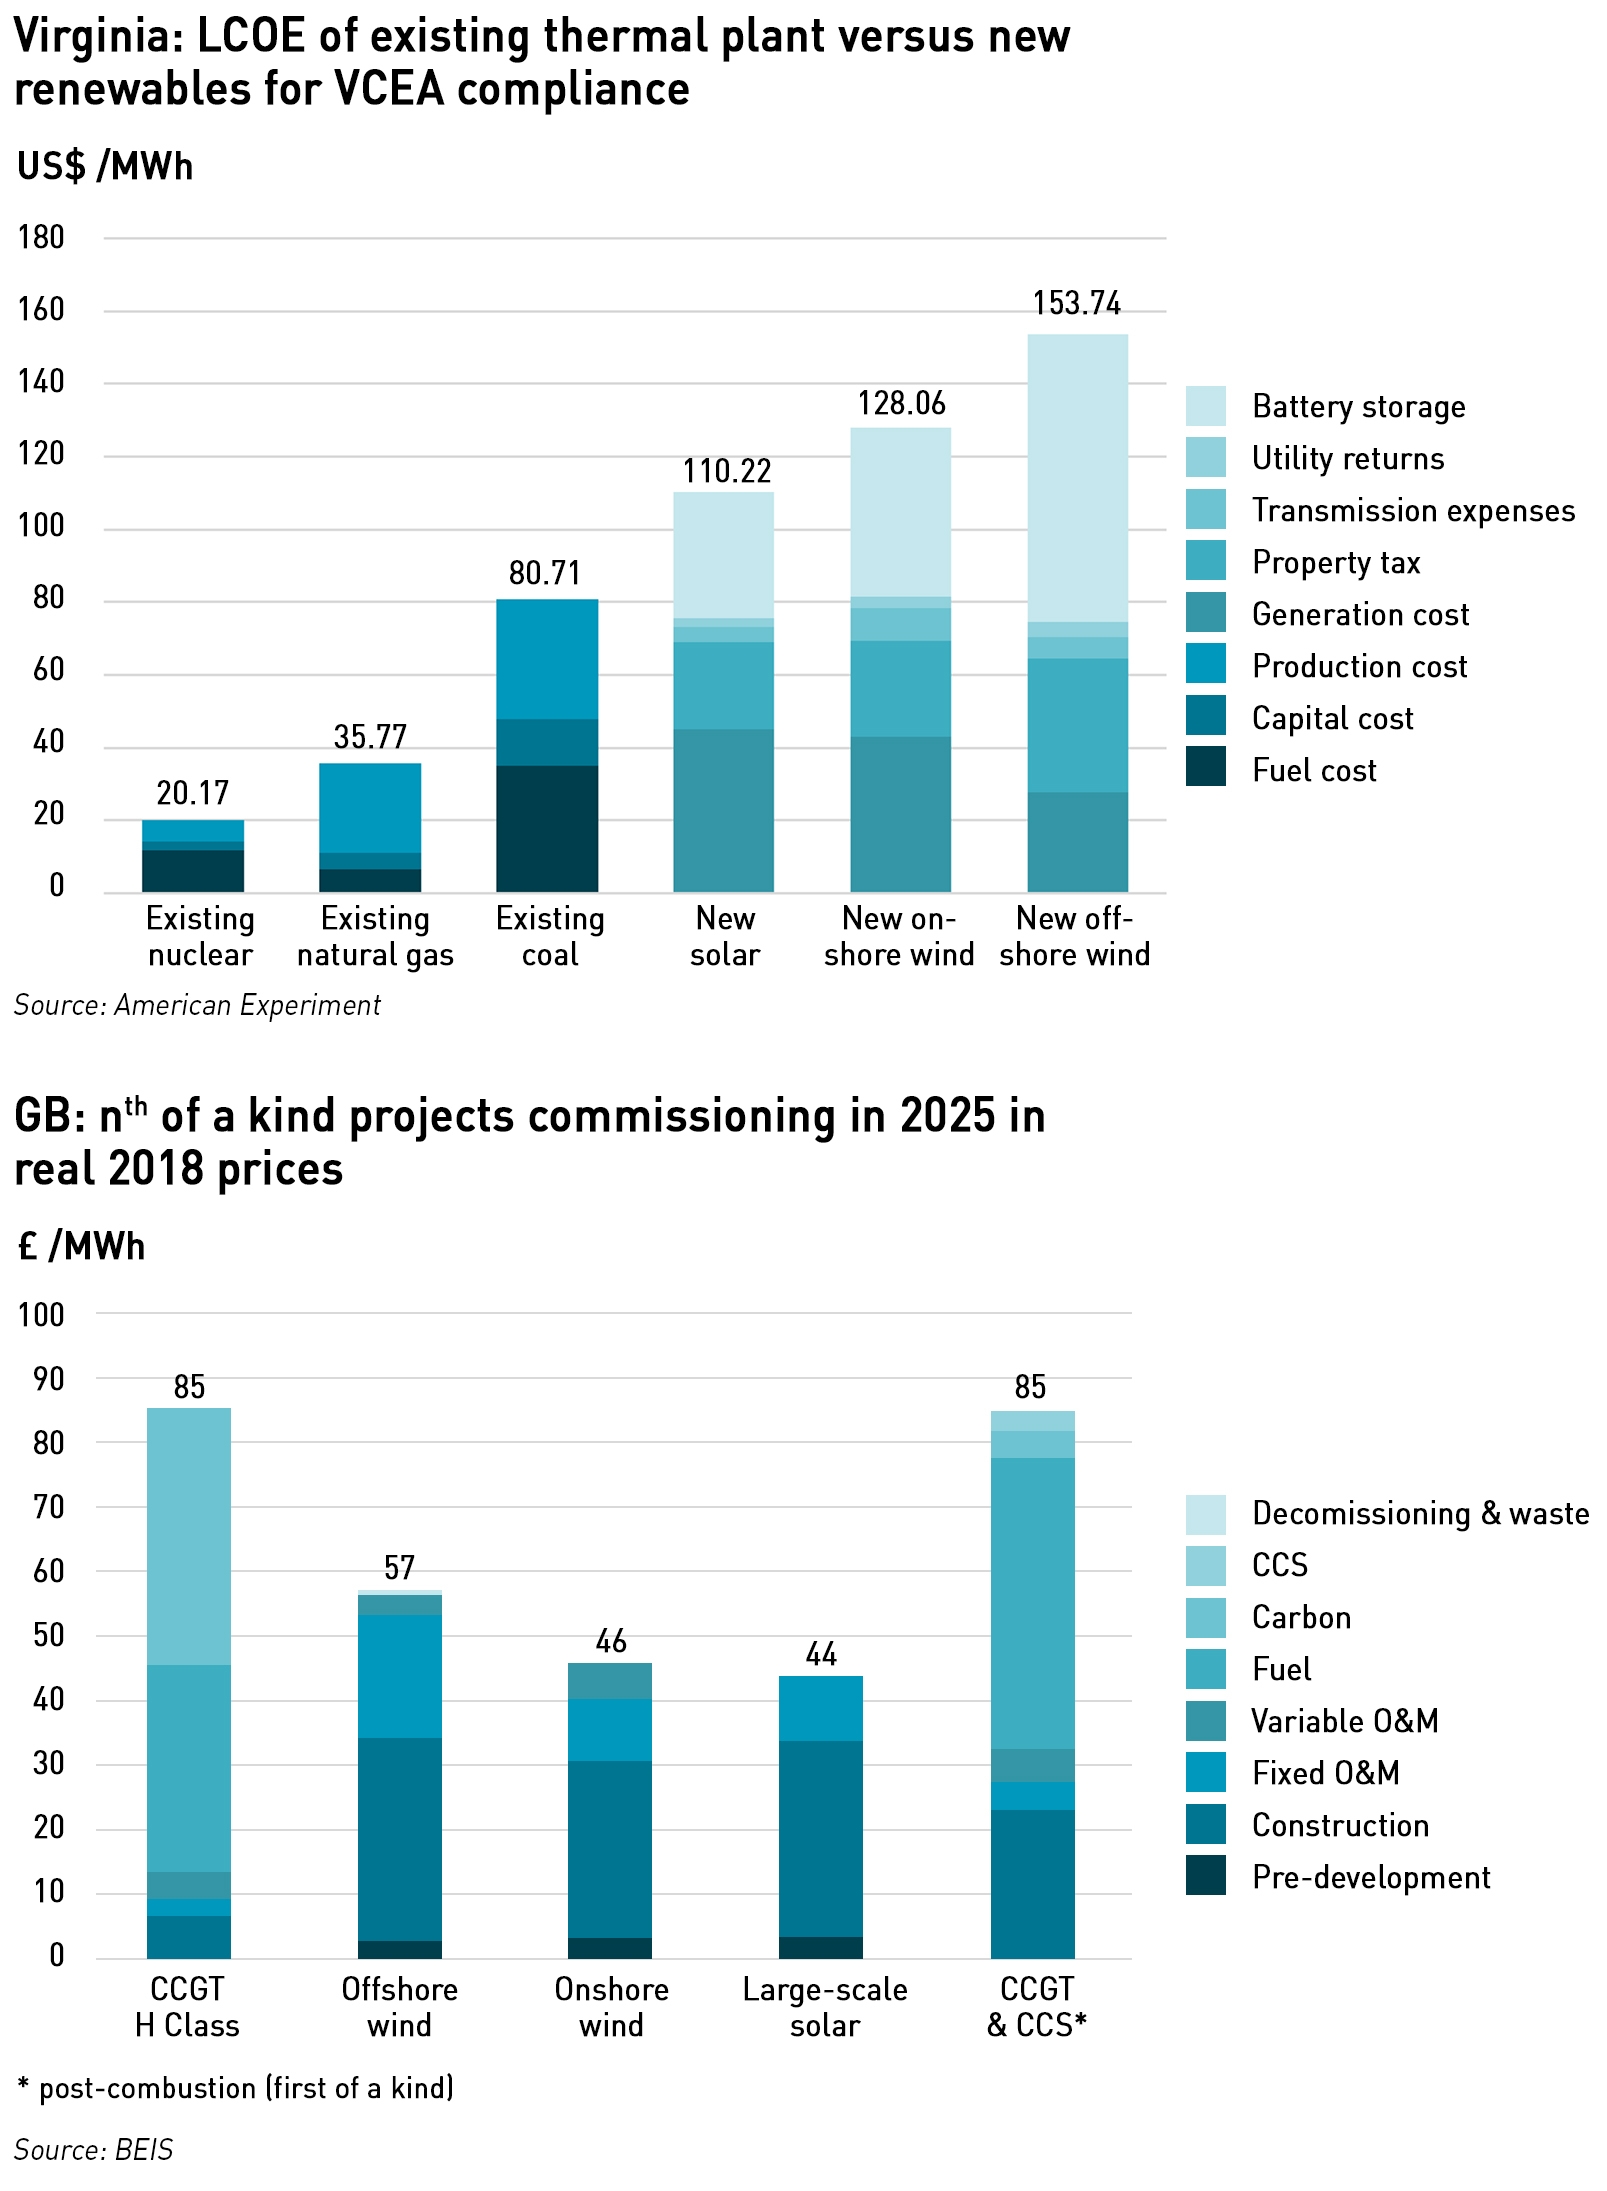 comparisons.
The key inputs in the BEIS LCOE calculations are pre-development costs, construction costs, fixed and variable operations and maintenance costs, the load factor and the operating period. So while the costs are adjusted to reflect periods of intermittency they do not include the cost of the technology required to fill the gap. This means that comparisons with conventional generation are flawed since conventional generation will provide electricity whenever it is needed and does not depend on unpredictable external factors such as the weather.
Another recent study by the University of Nottingham has shown that a wide-scale deployment of small-scale renewables can reduce grid resilience and may lead to failures. They studied smart meter data to track changes in grid composition over time and found resilience varies over the course of a day and that a high uptake of solar PV can increase the vulnerability of the grid. They also found that the addition of domestic batteries, while supporting consumer self-sufficiency, does not significantly reduce these risks.
“The increasing proliferation of small, intermittent renewable power sources is causing a rapid change in the structure and composition of the power grid. Indeed, the grid’s effective structure can change over the course of a day as consumers and small-scale generators come on- and off-line. Using data from smart meters in UK households we tracked how grid composition varies over time. We then used a dynamical model to assess how these changes impact the resilience of power grids to catastrophic failures. We found that resilience varies over the course of a day and that a high uptake of solar panels can leave the grid more susceptible to failure,”
– Oliver Smith, researcher at the University of Nottingham
There are just over a million small-scale domestic solar systems in the UK. They are low-output, intermittent and tend to be distributed across power grids in large numbers. The power they supply to the grid in export mode is unpredictable with generators going on and off-line intermittently – households adopt the role of consumers or producers, as usage and weather conditions vary both throughout the day and across the year. The Nottingham analysis shows that microgrids spend most of their time operating in the least favourable conditions for grid resilience, across all ranges of PV uptake due to a supply-demand discrepancy. This means microgrids are alternately dominated by either consumption or generation and are therefore unable to exploit the robustness advantages that increased distribution would be expected to provide.
Domestic batteries are designed to support consumers in being self-sufficient, and are rarely configured to export to the grid in a domestic setting, meaning they do little to mitigate the effects that domestic solar has on the grid. While new technologies such as V2G (vehicle-to-grid) services may help to meet this need, appropriate power control systems will be essential to capturing this potential benefit, as well as a willingness on the part of consumers to relinquish control of their assets to third parties.
.
End user prices have risen steadily over the past 20 years, in line with the subsidisation of renewable generation. While correlation does not necessarily indicate causation, no such trend is evident in wholesale prices, and with the increased deployment of renewable generation, consumers have faced not only the costs of subsidies, but also the costs of building new grid infrastructure to connect these renewables, as well as the costs of balancing their intermittency and providing back-up for when wind drops or there is no sun (it is depressing how often people need to be reminded that the sun sets before the winter evening peak, meaning solar contributes absolutely nothing to the periods of highest grid demand).
The past few months have seen a significant increase in wholesale prices. When added to the other cost increases, this is making electricity increasingly unaffordable for many consumers. As fuel poverty rises, it is time to recognise that renewable electricity is not cheap. This does not necessarily mean it is wrong to develop it, but it is time to be honest about the costs, and consider pausing new subsidies while issues of affordability are addressed, particularly as the cost of new projects is set to rise.


So, like your previous blog on the energy strategy, what’s the best answer to:
– Energy Independence (for the UK)
– Low cost and reliable electricity
– Saving the planet
I’m attracted to;
– Small Nuclear, more local – (like the rolls royce subs ones)
– Local storage and generation – whether thats pumped storage or the hydrogen thingy, supporting solar, wind etc
But I can’t make a technical justification
In the short term the solution has to be keeping coal open (the climate impact would be minimal but we need it as insurance) and more gas. Longer term we need nuclear (large and small) and more storage. I’m not convinced the economics of hydrogen stack up as a storage only mechanism, but new technologies such as cryogenic and compressed air show promise.
And we need to address the demand side and tackle energy waste which will support all three aspects of the trilemma: susainability, affordability and security of supply.
The energy stored in compressed air is roughly PV, so at 500bar that’s 50MJ/cu m. Methane is about 39MJ/cu m at s.t.p., so even at 100bar you are getting 3910MJ/cu m. Not many sites for compressed air: the Larne salt cavern is the notable one.
The bankrupt firm behind plans for a large-scale compressed air energy storage (CAES) plant in Northern Ireland has withdrawn its planning application for the project.
Gaelectric, which entered administration proceedings in 2017, has withdrawn a planning application for its proposed 330 MW Larne project through KPMG, its liquidator.
Gaelectric submitted plans in December 2015 to Northern Ireland’s Department for Infrastructure for the CAES project in Islandmagee and in 2017 won €90 million of EU funding as an EU project of common interest (PCI).
KPMG has been running a sale of Gaelectric assets and had hoped to find a buyer for the Larne CAES.
The project would have required the development of three 230 000 m3 salt caverns approximately 1.5 km below ground level to store compressed air and provide between six and eight hours of energy.
Highview’s LAES is getting some funding, but it isn’t really suited to longer term storage, because you keep having to re-liquefy the boiloff to maintain capacity, eating into round trip efficiency – and it isn’t all that efficient to begin with unless you ignore “free” heat or coolth, albeit it can use low grade heat and coolth as part of the gasification and liquefaction processes. It is developing up to 2 GWh of “long duration”, liquid air energy storage projects across Spain for an estimated investment of around $1 billion.
For comparison, Coire Glas is 30GWh/1.5GW of pumped hydro for “over £1bn”.
All ‘renewable’ generation should be required to meet a certain level of reliable output, provided by local storage, at the operator’s cost.
What I see on-line is the following: Rolls-Royce reactors use highly enriched uranium (HEU), typically enriched between 93% and 97%, to power the submarines. I suspect we will not see that level of enrichment for non-military purposes.
Finally, a rounded view of the real cost of renewables. The dispatchability component is critical and conveniently left out. Can we change LCOE to SCOE (system cost)?
2022-04-11 @ 9am. Watt-Logic Renewables.
Kathryn,
Well done for blowing a hole in the Renewable craze and reminded the politicians the Sun and Wind only produce a volatile, unpredictable output. In the case of the UK we are fortunate to still have CCGT (Gas) stations which mirror the Renewables and make-up the shortfall on a daily if not hourly basis.
By courtesy of http://www.gridwatch.templar.co.uk/ I quote: –
Starting on Saturday, 19th March 2022, Wind was good with 13GWs from a possible installed 14 or so.
However, Sunday 20th March at 9am this had fallen to less than 4GWs.
Monday 21st March it was about 2GWs and in following days went even lower – often as low as 0.19GWs, until it recovered to 12GWs on Thursday, 31st March – a full 10 day period of basically no output.
It crashed again on Saturday, 2nd April to 2GWs recovering to 13GWs on Monday, 4th April but crashing on Sunday, 10th April to less than 1GW.
Solar was peaking between 7GWs and 2 during this period.
Remember, to use your kettle you need a 24/7 supply of power and without CCGT in the UK, Renewables would not have supplied it during this period.
For the Government to suggest a projected installation of 50GWs of Wind & 70GWs of Solar is plainly silly.
Fortunately, this Winter has been kind to us – I hate to think what would have happened had we have had a 1947, 1963, 1982 etc type Winter or with the state of the European & UK Nuclear situation – the coming Winters.
John Bowen
Your Clifford Talbot chart of wholesale gas and electricity prices should have the scale for gas labelled p/kWh, not p/therm.
✓✓✓✓✓…. Well spotted… that unit rate had me confused as well…I was sure that I was correct…
Thanks – force of habit to label gas in therms. I’ve updated the chart.
I note that at the end of last month Ørsted sold a 50% interest in their 1.3GW Hornsea 2 offshore wind project to AXA for £3bn, hoping to book a profit of DKK9-10bn or over £1bn on the deal, and reflecting the comment you made about naive investors. That reveals a huge disconnect between industry and government expectations of the future cost of offshore wind. The project can expect say 600MW average generation, or 5.3TWh per year, 2.65TWh for 50%. The capital charge cost for amortising the investment plus interest is about 8% p.a., or £240m p.a. over the life of the wind farm. That implies over £90/MWh (240/2.65) just for amortisation. Maintenance costs are of the order of another £20/MWh. The current value of the Hornsea 2 CFD is £73.71/MWh.
It would seem that there is no expectation of taking up the CFD when the project is completed, and an expectation that even allowing for curtailment average revenues will be over £110/MWh. With no CFD protection for curtailment the project can expect perhaps 25% of its potential output to be worthless, so they are expecting production revenue to be over £145/ MWh, supported by capacity shortages and carbon taxes. I also note that Triton Knoll 3 still has not commenced its CFD despite commissioning in January: its CFD is currently worth £94.81/MWh.
It is starting to look like those low strike price CFDs are meaningless, other than for securing the right to build a project. The government are deluded if they are relying on them.
Overly negative
The 13-16MW offhsore turbines that will be installed in UK look to be around £2.5 million per MW capacity installed
Of which the turbine itself is less than £1 million per MW
A 1GW offshore farm will cost £2.5 billion if it lasts 27.5 years it will generate 144 TWh
If you borrow financing at 3% and inflation is 3% it nets to zero so to keep it simple £2.5 billion/ 144TWh = £17.36/MWh
And since the turbine itself is only about 40% of the cost its quite likely that in 25-30 years when these things are end of life a lot of the infrastructure will still be functional so the second time around it might be £1 billion /GW just to replace the turbines as the foundation and offhsore and onshore substations should be good for a lot longer than 25-30 years
I don’t know about overly negative, your overly simplistic model of turbine only costs ignores the other 80% of the cost model of landing the energy, interconnects, losses and maintenance, the interest and deprecation on the collective assets, and one assumes the profits the owner would expect to return.
Maintenance costs rise over time, and once past design life rise disproportionately – tech moves on and holding spares for 25 years also gets expensive, so in special markets, the product has a life that’s the end of it, patents and protections mean this isn’t, and just like your EV, an Internal combustion engine with aftermarket spares to keep it on the road!
I read your blogs with much interest and admiration for your depth of analysis.
Clearly, more energy storage is needed to accommodate the problem of increasing intermittency: but I haven’t noticed your taking into account the possible/probable technical advances that, potentially, could make a significant contribution to solving this problem. There are several unused mine cavities in the north of England which could be converted to pumped hydro facilities provided surface storage could be arranged. More promising is the RheEnergise technology, now being developed, which could, potentially, provide energy storage more amenable to control by grid management than small-scale solar generation. Another technology being developed, by FuelPositive in Canada, would have the potential to consume surplus energy as it became available and release it as a green fuel, ie ammonia or hydrogen.
You may find this interesting
https://www.current-news.co.uk/blogs/a-new-generation-of-pumped-hydro-rheenergises-high-density-hydro-solution-opens-up-geographies
The reality is that these are small scale operations, really designed around shifting solar from midday. 10-50MW with 4-8 hour duration, provided you can find a convenient hill: E=mgh is still the underlying physics, even if V can be cut because ρ=2.5 in m=ρV. I get the impression that the design is for enclosed reservoirs. It’s not going to begin to touch the interseasonal storage requirements of a high renewables grid.
The ammonia project is basically high cost green hydrogen plus standard nitrogen extraction fed to a small scale proprietary process replacing the high pressures and medium temperatures of the Haber process. To be competitive it needs subsidised or free power for electrolysis. Free power is in fact subsidised by the power that people pay for. TANSTAAFL.
Peter,
storage can never make up for intermittency, it’s simply the reality that wind does not produce very much and rarely does it get close to maximum power. From Dr Capell Aris’s paper:-
The model reveals that power output has the following pattern over a year:
i
Power exceeds 90 % of available power for only 17 hours
ii
Power exceeds 80 % of available power for 163 hours
iii
Power is below 20 % of available power for 3,448 hours (20 weeks)
iv
Power is below 10 % of available power for 1,519 hours (9 weeks)
While he calls it a model it is based on real data over several years.
However while intermittency is a large (unsurmountable) problem there is also the matter of a lack of inertia, a lack of reactive power, a lack of short circuit current level, all essential to a reliable and stable grid.
In short wind is unsuited to large scale grid supply, and solar is far worse.
The UK would function fine with the following
50GW CCGTs = £40 billion
50GW offshore wind = £100 billion
That would get ~263 TWh from wind power
The same £140 billion could only buy you ….
17GW nuclear = £115 billion
33GW CCGTs = £26 billion
You would get 134 TWh nuclear
So £140 billion buys you twice as much offshore wind than it dies nuclear. In both examples you have 50GW firm supply
The economics of offshire wind in the UK has won. Its just taking time for the anti wind crowd to accept reality
Lots of holes in your numbers. Demand is a variable, especially if you aim to include heating. Wind is not going to yield 60% capacity factors, and it will often be producing when demand is low, so the useful output is way below the total because of curtailment: capital cost is “ambitious”. Costs need to include fuel and maintenance and other elements such as grid costs, and recognise you’ll be replacing the wind farm after 20 years or so along with supporting batteries every 10 years. Your nuclear costs assume we build expensive plant. The RR SMR costing would be £65bn for 17GW.
Lets not overlook the vast amount of CAPEX NG is proposing its needs to invest in the grid to transport the renewable energy to where its needed as well the millions being invested in battery projects to provide frequency response services. All of this will be added to our bills particularly the standing charge. So even if you turn every thing off you will still be on the hook for £100’s a year.
“Let’s not overlook the vast amount of CAPEX NG is proposing its needs to invest in the grid to transport the renewable energy to where it’s needed ….”
And that’s before Greens and enviros object, and so attempt to add £multi-billions to the transmission costs ….
https://www.edp24.co.uk/news/23052367.row-cost-running-pylon-route-offshore/
https://www.nationalgrid.com/electricity-transmission/document/146091/download
In a sale of interest the original cost of the asset is largely irrelevant. Indeed, Ørsted expect to book a profit of over £1bn from the sale. The price is essentially defined by the expected revenues, and that’s the key point here. Ørsted are only offering a 20 year maintenance contract, so your life looks to be on the high side.
Looking at the CFD payments now we have the uprated April indexation in place I note there is as yet no sign if Hornsea 2 which started generating in December, on top of the absent 3rd phase of Triton Knoll. Are these CFDs ever going to be exercised? The average CFD in payment weighted by production is paying £150/MWh, and now Drax and Lynemouth are finally faced with a Baseload Market Market Reference Price of £168.25/MWh for the next 6 months. Intermittents average strike price is now back over £160/MWh.
I nite that the Energy APPG that you talked to previously are holding a meeting on April 26th. Are you contributing or attending? They could do with a dose of your common sense and sharp analysis.
The problem with the Hughes numbers on offshore wind opex is that they treat the “opex” cost at the SPV level as representing the opex cost of keeping the equipment running at all when this simply isn’t the case. The way that OEM agreements for wind projects are structured is that during the subsidy period (when capture prices are guaranteed to be high) the OEM guarantees that if availability targets are not met, the OEM will pay out substantial compensation. This also has the impact of increasing the amount of debt in the capital structure since deals structured this way are much more bankable.
After the subsidy period ends, the operator has a range of options, including taking asset management decisions back in-house and simply paying the OEM for repairs and scheduled inspections as and when required. This is a very substantial saving.
Therefore simply extracting opex numbers from SPV accounts doesn’t work because it doesn’t get you the “naked” opex cost without the cost imposed by the OEM for providing a very high availability guarantee. Hughes assumes that these opex costs are really the marginal opex costs and therefore when the marginal revenue from power sales falls below these costs, the turbine becomes uneconomic to operate. This also has the obvious effect of increasing the capex component of LCOE since the operating life is now curtailed well before its technical end of life and the value of the foundations etc. is assumed to be zero since the project is assumed to end.
Actual estimates of marginal opex, built bottom-up from inspection and component replacement costs, are much lower, in the single digits £/MWh which justifies an extended economic lifetime for offshore wind assets. The capex for (at least) the foundations is also expected to be recovered over at least another generation of turbines since the lifetime of these civil structures is longer than the tower itself (due to aeroelastic fatigue loading) which in turn is longer than the generator and moving parts on the nacelle. The gearbox (if any) and blades have the shortest life and will need replacing on average during the CfD lifetime.
However it’s also important to understand the effect on the LCOE of high capex / low opex technologies like renewables and nuclear of low risk free rates. Since basically all the cost is up-front, dropping the reference from which debt and equity costs is derived is going to have a big impact on a discounted metric like LCOE. Compare with a gas turbine where on-going fuel expenditure is a much bigger component of costs and therefore financing costs are less impactful. We have had an extended period of low and dropping RFRs and the effect this has had on LCOE shouldn’t be discounted.
This is a really interesting and detailed comment. Like many interested in UK energy policy the details of how offshore wind remains economic at these low CfD rates is of some interest to me, so this insight is much appreciated.
My assumption has always been that the CfD price bid would as a minimum essentially be the price required to break even over the timespan of the CfD, in which case the Hughes methodology is very reasonable. Of course the fact that companies were committing bids at levels below what this would appear to be indicates that more factors were in play. I think the real interest is that we still don’t have a full grasp of exactly what the model is that these companies are using for these bids – though most would agree that securing the agreement for the seabed resource is probably key – which I think your comment fits with quite nicely.
Thanks for sharing the thoughts on the above. Very thoroughly described. Talk soon.
Could someone please explain how the CFD system works and why you consider it a subsidy?
I have come late to this post but let me thank you for such a concise and evidence based piece. It is refreshing that a at least a few people are looking at the facts rather than the prevailing narrative.
15 years?
“The crisis now unfolding, however, is entirely different to the 1970s in one crucial respect… The 1970s crisis was largely artificial. When all is said and done, the oil shock was nothing more than the emerging OPEC cartel asserting its newfound leverage following the peak of continental US oil production. There was no shortage of oil any more than the three-day-week had been caused by coal shortages. What they did, perhaps, give us a glimpse of was what might happen in the event that our economies depleted our fossil fuel reserves before we had found a more versatile and energy-dense alternative. . . . That system has been on the life-support of quantitative easing and near zero interest rates ever since. Indeed, so perilous a state has the system been in since 2008, it was essential that the people who claim to be our leaders avoid doing anything so foolish as to lockdown the economy or launch an undeclared economic war on one of the world’s biggest commodity exporters . . .
And this is why the crisis we are beginning to experience will make the 1970s look like a golden age of peace and tranquility. . . . The sad reality though, is that our leaders – at least within the western empire – have bought into a vision of the future which cannot work without some new and yet-to-be-discovered high-density energy source (which rules out all of the so-called green technologies whose main purpose is to concentrate relatively weak and diffuse energy sources). . . . Even as we struggle to reimagine the 1970s in an attempt to understand the current situation, the only people on Earth today who can even begin to imagine the economic and social horrors that await western populations are the survivors of the 1980s famine in Ethiopia, the hyperinflation in 1990s Zimbabwe, or, ironically, the Russians who survived the collapse of the Soviet Union.”
https://consciousnessofsheep.co.uk/2022/07/01/bigger-than-you-can-imagine/
Not only will Hollandse Kust Zuid become the world’s largest offshore wind farm – stealing the title from the UK’s 1.3 GW Hornsea 2 – it’s also the world’s first offshore wind farm to be built without subsidy.
Hollandse Kust Zuid will have a renewable electricity output equivalent to the annual consumption of an astounding 1.5 million Dutch households. It’s expected to come online this summer.
Oh dear, there are problems with this analysis that the author has missed completely, which, to start with, just taking the costs in £s of each power production method into account misses one of the most important negative economic aspects of continued generation/fueling using fossil fuel imports.
If you have two technologies where one provides manufacturing and maintenance jobs within your country, and then the other provides the same, but with the addition of fuel imports to the tune of 10s of billions or even over 100 billion per annum, which would you choose?
A country that isn’t as productive earning foreign exchange cannot afford to keep imports high for too long.
Having a country running a negative balance of payments to the tune of 10s of billions or 100 billion or more annually gives a broader countrywide inflation effect that acts to reduce the standard of living. Energy is the fundamental input into our societies that drives inflation. In the 1970s it was the oil price spikes that drove many countries to more economical cars to reduce oil imports. That oil price spike caused inflation that every worker who at that time hit a cost of living crisis did exactly the same as was done in the last 1-2 years with the gas price spike, they needed more wages to live.
How are the abnormal costs of price spikes taken into account in this limited cost analysis?
What happens when price spikes are a greater threat to economic stability than grid voltage or frequency?
If a country can’t balance its imports and exports or at least have higher exports than imports, then it isn’t paying its way and will end up defaulting on debt or have higher inflation due to the currency being devalued.
Just as a grid has to be balanced, so too do the economics, at all levels, personal, company and country.
The economics of power generation and usage are far bigger than the rather simplistic analysis of LCOE calculations on their own…….this is a typical engineer/business only narrow view. If the major western governments have to push renewable power to stop the citizens and companies bleeding the countries dry economically due to importing so much fossil fuels, then aren’t the governments actually protecting the country from the rather blinkered view of “fossil fuels are cheaper”.
There are different layers in economics and having higher GDP based on importing fossil fuels does not create wealth if it is at the expense of governments having to borrow more and more or print more and more money to balance the books, or to ensure that there is enough money in circulation……..a balance of payments deficit isn’t balancing the books.
Even the Nottingham University study is flawed because once you get to excess power availability, i.e. having renewable power sources capable of supplying an excess of power, to say water hydrolysis for production of hydrogen, the management of the grid is simplified in that just by varying the rate of hydrogen production can absorb any increase/decrease in output. Even battery storage can be tuned in such ways, i.e. turning on/off/varying the input absorbing the excess that’s available.
Just as power output can be varied at power stations to maintain the grid balance, so too can power usage.
Anyone who has operated an off-grid system where you have a heat dump for excess power knows that renewable systems can be reliable if you have a diversity of sources, and have cheap means to deal with excess power that you have to generate some of the time, or other means to reduce power production.
In the past, how much gas was flared off by oil rigs dealing with excess gas or any gas from oil wells, where they couldn’t export the gas?
Having say 20 million individual 3kw home PV solar systems is the same sort of effect as having 20 million homes with fridges, freezers, washing machines, dishwashers, vacuum cleaners, jet washers, lawn mowers, power showers, where instead of variable power generation from the PV solar there is variable power usage. You still have to balance the grid with other power stations, it’s the same problem, but with a different cause, but every grid is being managed perfectly well to achieve that.
What about the old problem of the advert breaks for certain very popular TV programmes, where there could be a sudden demand for 3kw kettle x 1,000,000 viewers = 3GW. These were happening all the time, and to just look at power exports from a few PV solar systems misses the complexity that was already present.
And what is wrong with having say hydrogen gas power generation to back-up renewables. What happens when you can generate excess hydrogen and burn it in a gas turbine or use it in a fuel cell, shifting from methane (natural gas) that is used at present?
If the life and maintenance costs of a gas power plant is based on hours running, then surely having an asset running for more years (fewer hours per annum) isn’t writing off the capital value so fast, and so the economic benefit of reducing the cost of CAPEX per annum for back-up power hasn’t been analysed at all.
Yes there are additional costs at present, as with any new technology that is in rapid development, there are additional R&D costs, how else have we gone from 100kw to 15MW wind turbines in the last 30-40 years, but as with any R&D, you do it with the expectation that it will either reduce costs or increase income …….in the future…….not today, in the future.
You can analyse the costs of individual power stations from here to eternity, but if you don’t actually look at the macroeconomics and alternative means other than coal/oil/gas (natural gas) for back-up you will always be behind the curve and be complaining about the changes when there are so many advantages that will be achieved with the shift to renewables.
If only these “economic experts” would look at the whole economic picture, and the future economic picture in 10-20 years time perhaps then a better perspective would be achieved.
Hello Mr. Stone,
there is a significant flaw in your argument. Simply the talked about transition to renewable generation is never going to happen. There is a mistaken asumption that renewables are equal to conventional generation; they are not and cannot replce it.
Renewables are practically (intermittency) and technically unsuited for large scale grid supply. (A grid is different to a stand alone system which you infer is reliable?).
Taking the U.K., the backbone of our grid is closed cycle gas generation, which contrary to your belief, is not just back up but runs continually to provide the inertia and reactive power that renewables do not provide.Yes, at times it runs at very uneconomic levels but without it the grid will fail. You might also be surprised at how little renewable generation there is on average. Surplus to produce hydrogen, we never have a surplus of wind power (we do on the other hand have a deficit of grid capcity to carry wind power from Scotland on the rare occasions that wind is very strong.. From an engineering perspective the north sea is a poor location given the demand centres are very far away.
The high electrical unit cost that consumeres have is due entirely to the expansion of renewables for over two decades. They can never be cheap as they cannot run without a duplicate system of equivalent capacity as support. I.e. two different genration systems where one will do, gas. Coal should never have been phased out to make an alternative source as it is our fuel eggs are all in one basket.
The other point is that we have gas that we could tap so the import of gas would not be so critical.
High electrical cost does impact industry and it’s competitiveness and is also inflationary.
Your comments are interesting in that they portray a perception of the inability of renewables to generate power at the scale and in such a way needed to replace coal, oil and gas.
No one I know has ever suggested that renewables are equal to current generation. They have different technical characteristics and a National Grid has to be adjusted in terms of types and numbers of power stations to cope with the significant differences in especially due to wind and solar PV variability.
Currently the UK has about 28GW CCGT power stations, and typically I have seen between 4GW to 15GW used over this summer 2023, where on some days 67% of the electric grid power is being supplied by wind and solar i.e. only 10% of power coming from CCGT power stations…..ignoring biomass, nuclear, hydro (direct or pumped storage)….that gives a 10 to 50% capacity factor range of utilisation for CCGT. How much longer will those assets last if they are working at that range of capacity factors?…..let’s take a 33% average, which means they should last 3x longer……..Overhaul periods are time based measures in hours of running time. There may be a increased maintenance requirement due to temperature cycling, but is that really significant? Most engines last longer when they are run at lower power settings. Yes there may be the requirement to have other power stations, but instead of lasting 25 years, they may be able to last 75 years. The calculations start to change significantly in terms of the LCOE for the power stations that keep the system reliable. The use of renewable power is changing the LCOE for CCGT power plants.
How you can say that renewables are unsuited to grid scale power generation is beyond me. If you believe that a grid system with only solar PV and wind as it is generated at each instant in time isn’t reliable, then yes, you are correct that we cannot rely on a grid system built on such a basis, but no serious professional engineer would design a system like that.
So the question is how to deal with the intermittency, and how to deal with sudden demand increases/decreases.
I know that CCGT plants are not acting as back-up for now, as some CCGT power is on all the time as renewables cannot supply all the power the country requires, but let’s split this out a bit. Currently we could have say 4-5GW of CCGT plants supplying base load, and then as wind and solar varies, the rest of the CCGT capacity could be easily defined as back-up power. It is splitting out the CCGT into two groupings (theoretical). What would happen if we got another 4-5GW of biomass, then all CCGT would be defacto back-up power. As soon as CCGT plants are not operating 100% of the time, then they are back-up power. The grid will start to get periods of no fossil fuel usage from about 2025 onwards, just as coal is used infrequently now in the two remaining coal fired power stations.
We currently have 28GW of total wind power but what happens when we get to say 80GW of off-shore wind with a 40-45% capacity factor, i.e. if you can somehow spread the power generation evenly when required, you get 32 to 36GW of power, which is about the peak we need in summer. So all we have to do is store the excess when there is some and then turn it back into electricity fed into the grid when there is a deficit.
Off-grid systems have used battery storage for decades, where the batteries are on charge when the sun is shining or the wind is blowing, but some have a diesel generator if the battery charge gets too low, a slightly different system, where all generated power is converted to storage before being converted to high voltage AC, but this is where a National Grid would have this type of set up as a partial component, where there is much power capacity that feeds straight into high voltage AC.
The National Grid has started using hydrogen fuelled back-up generators for substation power when they have a problem.
What if we need hydrogen fuel for lorries powered by hydrogen fuelled ICEs, which appears to be one of the popular technological strategies for the haulage industry, because they don’t like battery vehicles because of the horrendous capital investment needed.
So what if we get 10s of GW power rated electrolysers to produce hydrogen from water and install them where the CCGT plants are currently? The hydrogen can fuel ICEs, fuel cells or jet engines (CCGT).
Yes some of the CCGT power plants may be running 24/7, but some are on standby, not operating. If we need back-up power and there is going to be a market for another potential fuel that an excess capacity of wind power can provide at times for storage ready for use when required, isn’t that far better economically, providing technical jobs operating plant, instead of importing hydrocarbons as fuel from foreign countries, losing huge chunks of currency to do so?
Do you want high quality jobs in this country, or do you prefer to import everything and run a balance of payment deficit?
With hydrogen production by electrolysis you would be replacing highly inefficient fractional distillation costs of refining oil, and possibly other chemical processes that are used in fuel production.
The structure of multiple industries start to be affected, so you cannot in anyway at all compare the LCOE of wind/solar PV/CCGT/biomass/coal etc as separate power generation means. The complexity of a number of different industries being affected means that until you work through a whole economy/grid scenario and the synergies that can be attained across multiple industries, and come up with reasonable means to provide a reliable national grid power scheme, you can only take aim at each separate individual technology and shoot down the ones you don’t like.
I’m not suggesting that hydrogen is the only answer, I’m not even suggesting that it has to be a major component, but it is one possibility.
I have seen similar limited cost analysis done within a company that I used to work for, where they used to load overheads onto each product and then say, oh, it’s not profitable, but then they forget that as they delete the one product, that it increases the overheads on every other product, such that all the others are made less profitable……not by much, but they got to fewer sales supporting the total overheads that don’t actually change……..leading to lower profit overall…….completely barmy economics. You have to do whole system analysis. It’s one reason why I could get a 70% efficient boiler and get a 20% reduction in gas usage, and with further investment in renewable technology I’ll get another 20% reduction in gas usage this year, without using any significant mains electricity to achieve it, or perhaps a few kwh over a whole year due to control circuitry. The load factor on my boiler is decreasing as I introduce new controls and new renewable technologies…….it will get to a zero load factor at some point…….I’m still using a 70% efficient boiler, but my gas usage has declined and I’ll be at over 40% reduction in gas usage.
With any economic analysis where a new technology affects a whole country, you have to do a whole country analysis and you cannot just take the one technology/industry/company. Whole country economics are non-linear systems, where there are adverse effects and beneficial effects that need to be considered.
How much less oil has been imported due to the shift to battery electric vehicles?
I’m just glad that the changeover to renewables is happening and has been in progress for the last 20 years.
When India and China really get going, i.e. actually consume coal, oil and gas at the rate that America has been doing so per capita, what do you think will be the price of your cheap hydrocarbons then?
You might be surprised that we generated about 48% of our total electricity from renewables in the first quarter of this year 2023………they’ve replaced coal, and with CCGT plants and the reduction of electricity demand overall over the last 15-20 years, the CCGT plant capacity has not had to be increased. We would have had the same amount of gas CCGT with coal………the benefit is that we are not putting so much carbon dioxide into the atmosphere. Carbon productivity has increased, now it varies between 50 to 250g/kwh. It used to be between about 300 to 550g/kwh. Yes it is far more variable now (5x range increased from 2x range) but it has decreased significantly overall.
Even China generates over 30% of its electricity from renewables……what if they were burning coal instead?…….that would have been madness!!
Even the CCGT plant load factor decreased from 60% in 2010 down to 30% overall in 2013 as renewables were initially added, but shot up to 50% when many coal plants were closed around 2015, but has since declined again to 40% even as we are down to the last two coal plants……..isn’t that what’s going to happen now, the CCGT plant load factor will decrease year on year as more renewables are installed?
What will the grid look like when CCGT (natural gas) plant load factor gets to ZERO?
I can design a National Grid that works on renewables……can’t you?
I never had any problem with the price of electricity even with the investment in renewables, until there was a shortage of natural gas that pushed up the prices…….if only we had had more renewables and electric power heat pumps………the cost of electricity wouldn’t have been affected in the slightest, and we wouldn’t have had any significant increase in inflation except from buying goods/services from those countries that were still using gas to generate electricity……..and the government wouldn’t have had to borrow even more to pay for the price cap to protect the poorer people from the huge drop in standards of living….cost of living crisis…….or where have you been?
It wasn’t the investment in renewables that suddenly increased the cost of gas and electricity.
Fossil hydrocarbons as fuels…….the sooner we’re off them the better!!
Hello Mr Stone,
that is far too long a reply to digest.
However taking an early point, even if the CCGT is running at very low putput collectively they still provide inertai and reactive power that renewables cannot. It is a terrible way of running a grid and as we know too well it is expensive running two parallel systems. Really only the gas is necessary the renewables are a dreadful mistake
As the likelyhood that CO2 is the the driver of our climate, the latest scientific research is indicating otherwise. However such is the inertia of CO2 being the sole driver of our climate pushed by the U.N. the latest science is finding it hard to get heard. (natural causes of climate change which have occurred since forever is presumably taking a holiday?)
If you are convinced then the only generation source that works and does not emit CO2 is nuclear, with that perspective, it is Hobson’s choice.’
Sorry for the long detailed info, but some complex issues give the wrong answer if you don’t deal with all the detail.
There are many types of renewables, biomass, anaerobic digestion (methane), waste incineration, tidal, hydro, solar PV, wind, geothermal, oil seed plants (bio-diesel or bio-Propane from reduction of glycerol from bio-diesel production), methanol, ethanol (sugar beet/cane)…..just to name a few.
If an engineer cannot split out these different sources of energy into dispatchable and non-dispatchable forms, and create a reasonably stable power supply, then we have got problems.
There is a lot of bio-diesel, ethanol and bio-propane being manufactured. What happens when the number of petrol and diesel cars on the roads are reduced, surely there could be plenty of fuel to run a few power stations on those fuels, instead of natural gas. What happens if houses are required to convert to electricity only, and LPG for home heating is banned, or are forced to use CHP instead of just a boiler.
Norway works on 90% hydroelectric, and we have an interconnector to them, then there are other interconnectors to Holland, Belgium, France (2 off) (nuclear), Ireland.
Yes there is a need to have more capital investment in the infrastructure, i.e. power plants but this is replacing fuel costs and there are efficiency gains if say instead of having power stations working at 50% efficiency, there is a policy towards CHP only, where the 50% of the total energy as waste heat is legislated against if say home owners/businesses can choose between CHP or heat pump.
Just think, if all 30GW of CCGT power stations are running, we actually burn through 60GW of fuel energy………there are many more efficiency gains still to be made……..why do you think that larger hospitals and companies and universities are going over to CHP?……..The savings are phenomenal.
If say the dispatchable forms have a limited source of fuel, and so can only be run for say up to 1 month with their stockpile of their specific fuel, whether it is waste, etc etc. If there becomes plenty of supply of these dispatchable fuel sources at a low enough cost then they will start to dominate the power generation to the grid and the other forms will be retired on economic grounds if there is an over supply.
The problem is that it isn’t a level field for all the different technologies, where some have had billions in R&D spent on them and others still have significant technical problems to overcome.
Natural gas isn’t essential, it can be replaced with various combinations of other dispatchable power from other fuels.
What if the water treatment plants are turned into a broader waste processing and power generation plants with anaerobic digestion and burning the solids, not just sewage and they become a local power station, rather than just creating energy for their own facilities.
What if every one of the 20 million homes is fitted with the equivalent of 5kw solar PV……giving a vast excess of power during the summer as people find it gives them cheaper electricity overall and they can get a return on their investment…….100GW peak output……far greater than the 35GW we require in the summer.
The future of the power grid using renewable energy isn’t going to be a problem of getting enough energy, it will be all about controlling the different forms/sources that will be available. The cost effectiveness of CHP and self-generating solar PV and even wind turbines for specific factories may mean that even with increasing power consumption overall, the capacity of the National Grid needed may decline further.
It will be up to National Grid plc to sort out the contracts and control mechanisms necessary to maintain a stable supply, even if they have to redefine all dispatchable power plants as “peaking/back-up”.
How many homes will have battery systems, and how will they be configured and what rating (capacity) will they have, and will many homes shift to becoming off-grid instead of grid-tied, where they use the grid on a timer for cheap electricity to recharge their battery during periods of over-supply, and then can be set to dispatch to grid when the price increases during periods of under-supply.
Do not assume that the same centralised capacity will be needed, do not assume that we will have only electric supply or boilers, or just heat pumps or just fuel cells or just CHP (microturbine/ICE) the whole UK Grid is going through a significant period of evolution, and it may not end up in a structure that anyone was expecting, but in terms of fuel burnt, it will become much more efficient, i.e. gCO2/kwh is going to decrease.
Iain Reid raises the point that new research supposedly indicates that excess CO2 in the atmosphere is not the main driver of climate change. He doesn’t provide any source for this information nor have I seen any evidence of it.
Hello Mr Stevenson,
there are so many sources of this information if you would look.
The discovery that some gasses could absorb and re radiate infra red energy was discovered by John Tyndal in the.1850s. There was also the discovery that it’s influence on climate falls logarithmically as concentration increases.
Other research has shown that H2O is the major greenhouse gas and is far more powerful both in it’s concemtration and the spectrum of infra red that it absorbs. CO 2 and the much vaunted CH4, despite being almost irrelevant, is both low in concentration and only absorbs a very narrow range of the infra red spectrum..
Try looking For William Happer and William Weingarrten’s (Sp?) research.
.
The graph in this article concerning the Average Annual electricity bill where the average cost goes from £300 to £700 per annum over the period 2003 to 2021 was attributed to the cost of investing in renewable generation. Somehow the author hasn’t remembered/known or wishes to say that the price of oil (brent crude) went from $20 per barrel in 2000 to $120 in 2012……………again wouldn’t all other fuels increase in price at the same time? so instead of a proper analysis of the true cause and effect of what happens when fossil fuel prices increase by 600%, we get an attribution to the minor cost of investing in renewables, and the beneficial returns that they actually provide is ignored.
Here’s the data on Gas supply pricing in the UK from 2000 to 2023, and just as there was a price spike in gas/oil prices in the 70s, it happened around 2000 following the stock market bubble (.com bubble), just as it did for Brent Crude that I mentioned above, and more recently in 2022. The prices were fairly stable from 1997 to the year 2000 at around 10 GBp/therm with winter peaks around 15 GBp/therm
Prices given from January each year……
Year GBp/therm
2000 11.57
2001 23.41
2002 20.05
2003 16.7
2004 21.56
2005 28.58
2006 61.44
2007 23.27
2008 51.18
2009 62.25
2010 38.77
2011 52.66
2012 56.25
2013 64.94
2014 61.12
2015 45.86
2016 30.59
2017 55.19
2018 48.95
2019 51.52
2020 24.18
2021 53.15
2022 203.08
2023 145.51
These really clever people who wish to push fossil fuels forget to mention the two periods of significant gas price increases each of 4x to 5x that have happened in the last 23 years alone, going from 11GBp/therm in 2000 to about 50GBp/therm around 2008 to 200GBp/therm in 2022
Yes the electricity price has gone up 2.3x in the period from 2003 to 2021, £300 to £700 average annual bills for those years respectively, but the gas price has gone up from 16.7 GBp/therm in Jan 2003 to 53.15 GBp/therm in Jan 2021, corresponding to the same period (3.2x over that period)…….doesn’t it actually indicate that the renewables are actually protecting consumers from the fossil fuel price increases? But with the variability of gas prices, it is within the statistical variation, so perhaps there has been no benefit or adverse effect between those years because of the way the price of electricity from renewables as wind power (renewables) pricing was linked to electricity generated from fossil fuels.
Perhaps if the renewable electricity pricing had not been linked to fossil fuel electricity pricing then perhaps we would have had irrefutable evidence of the benefits or true cost of renewables.
If you think not, then you had better get a job doing something other than commenting on the effect of the cost of renewables on electricity prices.
When the electricity prices suddenly went up in 2022, I know of someone who made the comment, “But I’m on the GREEN tariff, how can my prices increase, when my electricity generator (utility supplier) doesn’t use gas?”………..I don’t know if they were a hairdresser or a shop worker, but they certainly had a better idea that their prices should not have been affected by any gas price increase that occurred at the time.
When we get onto renewables, where the cost of the input of wind or sun or tide or water flow is ZERO, we should get some price stability, low inflation and cost of electricity that is only affected by the cost of capital and maintenance, with commodity price spikes of metals used in manufacturing only affecting the cost at the time of installation or maintenance, but with dispatchable generation based on burning some fuel, it will never happen, because with fuels there is a market for that fuel, and the price will always be variable with the market, so we need to reduce the dispatchable (fuel burning) generation of electricity to a minimum, to minimise its adverse effects.
The gas price may have gone down to a very temporary minimum of 9.63GBp/therm in May2020, but just two years later peaked at 458.9GBp/therm, it is not a recipe for economic stability.
Has anyone actually put this data into LCOE calculations to see how renewables perform against gas/oil etc?
Businesses hate these unpredictable costs, so wouldn’t the electricity generation industry actually be helping businesses if there really could be better price stability for electricity? Any business that invested in renewables such as solar PV would have been very glad that they had made that investment themselves in the last few years before the 2022 gas price spike, when national electricity prices are so unpredictable over a period of a decade.
These wild swings in pricing of electricity from being linked to gas prices would only have convinced more businesses that they need to do their own investments in renewables. If you can’t rely on a supplier, either you change your supplier, or you bring it in house. Investment in renewables, why not if it provides financial certainty over costs and a return on your investment through lower costs over 30 years.
Shall we see if the next rapid price spike/increase occurs around 2030-2040………it’s going to happen………it’s called a punctuated equilibrium, just like in biological evolution…..periods of rapid change……it’s a completely natural effect that certain LCOE calculations do not take into account.
We’ve got wind and solar PV and interconnectors and biomass that have replaced coal without increasing the CCGT generator capacity, and no, the grid won’t fall apart when we stop burning gas to generate electricity for periods from about 2025 onwards, despite what others may wish you to believe. We’ll just have to wait and see what other renewable generators come online in the next 10-20 years.
Perhaps you would like to explain why, if renewables are so cost-effective, AR4 is proving to be such a failure. Only 2 projects have taken FID, one has been cancelled and developers have been lobbying for enhanced economics through tax breaks. They are complaining that AR5 prices are too low. While OEMs are losing £ billions.
We have been subsidising wind power for >20 years, and yet developers still demand not just more subsidies, but an increase, despite the fact that they receive income far in excess of their SMRC. Of course, if electricity prices were based on the SMRC of renewables, no form of generation would EVER recover its capital costs.
The chances of us operating the electricity grid in GB without gas in 2050 never mind 2035 are pretty much zero, and I would be willing to bet we’re still running unabated gas. Why? Because it is unlikely to ever be economic to remove the last portion since the flexibility and reliability of gas generation cannot be matched by anything else. And the environmental impact is small, particularly when compared with all the coal being burned elsewhere.
Hello Mr Stevenson.
my apolgies for the slow response but I have been away from internet access for the week end.
“.These really clever people who wish to push fossil fuels ”
You still do not a seem to see to see or accept that the grid cannot run without them. If that is incomprehensible to you that is your problem.
We have considerable quantities of gas in the U.K. which we should use. Coal also is a very valuable source of power and we have destructively reduced that asset.. Not only is it economic it can be stockpiled. and could be a buffer for variable gas prices.
Hello Mr Reid,
I think your reply to me was intended for someone else as I didn’t make the comment referred to. Perhaps it was for Tim Stone, with whom I broadly agree.
We have to accept that all fossil fuels must be left in the ground and that we have to work around the consequences as best we can. Lives are already being lost around the world through heat, lost crops, floods, etc., etc.; but that’s nothing compared with the future consequences of our failing to act NOW.
OK, how to run a grid without fossil fuels?
Can you make the following fuels, without digging up or pumping carbon as gas or oil or coal out of the ground?
Gases; Methane – yes (anaerobic digestion – farms/sewage works), Hydrogen – yes (electrolysis of water)
Propane – liquid or gas…..from the reduction of glycerol from hydrolysis of fats from plant/animal/algae)
Liquids; Methanol – yes (destructive distillation of wood), Ethanol – yes (fermentation of sugars), Biodiesel – yes (transesterification of fatty acids from plant/animal/algae + an alcohol, see methanol/ethanol above)
Solids; Waste – wood/paper/excrement/cotton/wool/hair/nail clippings/biodegradable plastic = biomass
Can these fuels be burnt in an engine or a boiler of some sort to drive a generator?
All gases and liquids can be used as fuels in either Gas Turbines or Internal Combustion Engines.
The Biomass can only be burnt and turned into electricity in steam powered turbines, i.e. have to be used in a boiler, whereas the liquid and gaseous fuels can be used in a boiler as well as GT/ICE.
So if we have enough of one or more of these “alternative fuels”, we do not need fossil fuels, where all these “alternative fuels” can be used to create dispatchable electricity.
If we have more nuclear baseload, again, that would reduce the need for fossil fuels.
Let’s get back to hydrogen as a fuel. Town gas or coal gas produced from coal was a mixture of carbon monoxide, hydrogen, methane and volatile hydrocarbons.
Before natural gas (methane) was imported as LNG, or we started drilling the North Sea, this town gas or coal gas was produced in the UK, there were gas works all over the country, producing this town/coal gas from coal mined in the UK, which was stored all over the country in gasometers, such that the rate of production was constant, but the rate of use increased in winter and the quantity in storage was reduced, and was replenished in the summer, when production rate was greater than the rate of use.
Now if we as a country invest in electrolysers, and enough non-dispatchable renewable power, e.g. solar PV/wind, for the electrolysis of water, we theoretically could produce enough hydrogen for all uses, and if the rate of production is high enough, and we have enough storage, we can use the same strategy as we did for coal gas/town gas.
All we have to do is have just enough non-dispatchable power when they give a PERIODIC excess, which if we have say 50GW of wind turbines and 50GW of solar PV…just as an example to simplify things, I’m not saying that we have to do it or it’s the right way to do it, we theoretically could use the periods when there is excess power from those non-dispatchable forms of renewables to put that electricity into electrolysis of water to make hydrogen, which can then be burnt in CCGT to generate electricity when the wind doesn’t blow and the sun doesn’t shine.
But, as I said before, if you presently have diesel and petrol consisting of 10% bio-diesel and 10% bioethanol, made from renewable sources i.e. not manufactured from oil or gas or coal, and there is bio-LPG (propane). You could redirect that production output away from petrol stations to CCGT plant as the number of petrol/diesel cars decline, or with bio-propane as people switch to solar PV and wind turbines and battery power if they are not connected to the mains gas.
Yes, there currently needs to be dispatchable electric generation, which is provided by fossil fuels but, as I have said before, there are plenty of alternative fuels and means to create renewable fuels that can be used to displace the natural gas/LNG supplies that are being used.
i.e. there are many other sources of dispatchable power that can be provided from renewable sources.
I have also said that theoretically we could install excess of non-dispatchable power generators of such diversity, wind, solar pV, tidal, wave, etc etc, that with a CONSTANT excess, i.e. not a periodic excess as described above, we could control the output (balance the grid) by an electricity dump to a production process with that constant excess to actually balance the grid by varying the instantaneous power that is being dumped. Such a production process could be the manufacture of hydrogen by electrolysis………a perfectly feasible strategy, if we install enough of these non-dispatchable power generators of enough diversity of form/source.
What we should get to is a price inversion, where the cost of electricity is cheaper than the renewable and fossil fuels, because the renewable fuels will be produced from the electricity i.e. electricity will become the primary energy source, and not the fossil fuels. This last gas price spike is the precursor to this change. What should have happened was that with the wind turbines and solar PV, the spark gap (difference between the prices of gas and electricity should have closed, it should have reduced from the normal 3:1 ratio of electricity:gas prices, where all the power generated from wind turbines and solar PV, should have remained at a constant price, and diluted the effect, in a significant way, that the increasing price of gas was having on the overall price of electricity, there should be a changing ratio between the price of gas and electricity, where as we install more and more wind turbines and solar PV, the normal 3:1 ratio should drop, especially when there is a gas price spike, where wind turbines and solar PV have no fuel input costs.
It is only the fact that fossil fuels are the primary energy source at the moment that electricity costs more, because we produce electricity from those fossil fuels. As soon as electricity gets really cheap, with plenty of wind turbines and solar PV etc etc…..suppliers are only giving householders up to 10p/kWh…..usually only a few pence, if we get enough non-dispatchable capacity installed, such that there is an excess of capacity at certain times, which will be absolutely necessary, the market relationship between electricity and fuels is going to change.
There is negative pricing on certain days at certain times already, both for electricity and for fossil fuels.
If we get China and India consuming more fossil fuels, because they can’t install wind and solar PV fast enough, we really don’t want to be using fossil fuels at a high price as demand increases significantly, unless absolutely necessary.
In the next few years, this is approaching the riskiest time in terms of market price for fossil fuels, and whilst it is a good idea to keep access to North Sea resources, we really need to be keeping them in reserve.
By all means keep access to gas and coal and oil, but we need to minimise their use.
Overall, I know we are using them at present, and cannot manage without them at present, but there are ways and means to manage without them in the future.
I don’t know what the reserves are for all the fossil fuels, but ignoring climate change, we have a more pressing need to reduce our imports and to increase our exports, and Norway is better off with its sovereign wealth fund is accruing wealth because they are selling their hydrocarbons (fossil fuels), they don’t need to burn them as they have plenty of hydroelectric power generation. We really need to get onto a similar economic footing, where we become self-sufficient for energy. Yes we could burn through all our North Sea reserves, but if we have the technical ability to transition to renewable energy sources in a timely economic way, then surely we should do that.
I completely agree that at present we cannot run the grid without fossil fuels, but that doesn’t mean we shouldn’t be trying our damnedest to stop using them and find economic alternatives. It is only by overcoming tough technical and intellectual challenges that we improve our standard of living and reduce our impact on the environment, and develop the products and expertise/services to export to other countries.
Would you accept such a challenge or would you just keep things as they are with all the damage we do to the environment and ourselves and our economy?
I’ve done enough chemistry and engineering challenges and got a few patents, where products were developed and sold worldwide, that I know that all this is technically possible, the only important question is what is the most economic means to achieve all this?
Even if we could burn through all the fossil fuels, so much so that we would asphyxiate ourselves with all the CO2 build up in the atmosphere, do you really want to get to that stage? there’s plenty in the ground to achieve that…..because that is where we are heading if, and only if, there is no global warming that could decimate the environment before that.
It doesn’t actually matter what you believe in terms of how you think burning fossil fuels affect our environment, because if we don’t sort out our balance of payments and our national debt (at about 100% of GDP and increasing), we might end up with a crippled economy anyway.
We need to be as self-sufficient as possible, as soon as possible. You cannot argue with the fundamental economics of our country at present, we really have no choice.
Hello Mr Stone,
your last sentence is a point I made in my post wrongly addressed to Mr Stevenson. We ignore out natural reserves to a large degree.
Norway is fortunate in both bveing a small country and having large hydro electric generation capacity.
The problem with bio fuel, which could be used to power genertaors is that it is thermally low in it’s energy and expensive to produce. I don’t have the figures to hand but Drax Power Station consumes vast amounts of wood pellets per year for about a cica 3 gigawatt plant. It emits more CO2 now than before it was converted from coal of which there is significant reserves below the plant.
I’m sure I must have made the point that nuclear is the only way to go.
Don’t be fooled by the Chinese, they are concentrating on making cheap electrcity to keep their manufacturing going as much as possible. We should have the same philosophy.
I agree entirely about the philosophy.
Oh, I’m not fooled by the Chinese at all, I’m sure that they are well aware of the economic consequences, the question is if they have the ability to actually achieve what they need to do in the time available, where if we get there first we could be in a much better position…..after all they are still adding coal fired power stations because economically they are about 20-30 years behind us on their average standard of living if say you compare kwh used/burnt per capita. They still have a lot of peasants in some areas, running water and transport still a problem.
I agree with the costs of biofuels, which is why we are going to get to a price inversion at some point, where electricity will be cheaper than other forms, unless they just get to price parity on energy content – per kwh. A vast excess of solar PV or Wind will definitely change the market dynamics, or who knows, perhaps the next pandemic will wipe out 30% of the human race and there will then be a vast excess without any more needing to be installed….a few too many natural variables to predict.
But if you want to think about energy security, we really need as much capacity as possible that works with the lowest possible human input/intervention if we could get another pandemic that is 10x worse than COVID…….are fossil fuels the answer in that scenario?……needing lots of people to transport fuels could get tricky.
And on financial security, if we get a more severe pandemic, we really don’t need 100% of GDP borrowing…..it’s a huge risk. With economic and investment planning you have to keep your eyes open to all the risks.
I have tried to indicate that I am not against fossil fuels, but if it is better economically to use them for specific industries, i.e. use them as high value raw materials to only be used in critical production instead of just burning them for heat and power, wouldn’t we be better off?
Like I said at the outset, even just looking at the economics of the country as a whole, there are more important issues at stake than simple LCOE calculations.
I believe that diversity – strength in depth as the football managers say is the answer.
Why are you so poorly informed? China energy use per capita 2022 111.8GJ. UK 108.4GJ. Statistical Review of World Energy. Back in 1996 we used 165.7GJ/cap. The fall reflects in part a lower standard of living arising from deindustrialisation.
The idea that fossil fuels are labour intensive went out when manual hewing of coal became superseded by mechanical open cast mining and the development of oil and gas.
I suggest a visit to the real world sometime. Your posts are full of misinformed suppositions and lack the benefit of any attempt at estimating the scale of your proposals or looking at their consequences and infeasibility. I’d call it the CCC mindset which simply assumes things are possible without really attempting to evaluate properly, and which completely ignores costs.
You are evidently unaware that gasholders only held 2-3 days supply at low pressure. In the days of town gas the storage was the heaps of coal at the gasworks, just as the piles of coal were storage at power stations. North Sea fields became the means of providing seasonal flex as they took over from town gas. Norwegian fields have taken over the flex role from domestic production, and we are now supplementing that with seasonal LNG, which is also imported to re-export to the Continent which lacks LNG terminal capacity. Here’s the history since 1996 in a chart that shows the tiny role played by gas storage at Rough and in salt caverns.
https://image.vuukle.com/9ffc6604-feed-474e-a82d-c2de2f561502-4dfe7b0a-6bec-454e-9c89-aea7ddb7f274
Since it requires at least three times the volume to store an equivalent energy content using hydrogen in place of methane the existing storage can be seen to be utterly inadequate. That’s before we look at the atrocious economics and low capacity utilisation involved in trying to make hydrogen from sporadic and highly variable renewables surpluses. Instead of making assumptions you should try doing some sums as I have done. See this chart of surplus duration curves at various levels of capacity.
https://datawrapper.dwcdn.net/nZM72/1
Points to note:
You can’t get a constant excess because a significant percentage of the time there is very low output.
Any level of surplus above the installed electrolysis capacity is necessarily spilled or curtailed, increasing the cost of useable power.
Attempting to use hydrogen to make hydrogen when wind output is too low is thermodynamically stupid and costly
Lower levels of surplus are too intermittent and result in very low utilisation.
This is an optimistic picture because it assumes a copper plate grid with surplus capable of being transmitted to any electrolyser with spare capacity. In the real world the grid would never be built to take rare high levels of output.
To get surpluses capacity needs to exist to provide them. It does not come for free.
The reality is that we have made great strides to reduce the impact of pollution on our daily lives. Despite the incessant propaganda it really is not a prime problem any more. Since we do not control the world, what we do for alleged climate mitigation will have minimal, perhaps immeasurable impact, as Tony Blair has just acknowledged. A far greater concern is that in the futile and very costly attempt to pursue net zero policies we collapse the economy to the point where we simply couldn’t afford to adapt to changes in climate that do occur and simply suffer massive declines in living standards. Still some way off as we try to get a tan from sitting in the English rain – words written over 50 years ago – but the economic collapse is imminent if we fail to pull out of the nosedive of net zero.
It doesn#t add up.
isn’t that exact;y what the IPCC (U.N.) want?
They have blatantly stated they want to change the Economic Model that has existed since the start of the Industrial Revolution? And our politicians seem to be complying. Nobody voted for the U.N.
Thank you for your input.
If you think a bit wider than just things relating to hydrogen, and look at the energy industries oil/gas as a whole, there are some very important synergies and savings/efficiency gains available.
I’ve only ever given examples of how things can be done with renewables
Constant excess – wind + solar PV + tidal + wave + hydro……any other non-dispatchable forms anyone?… but the point was not that it has to be done that way……it’s an alternative……brain storming……just to say how hydrogen can be produced for other industries from renewables.
But, getting onto a scheme that can work…see below
I have never ever suggested that you run the electrolysis when you are burning the hydrogen to create electricity, you are absolutely correct, it would be stupid. It would rely on excess wind and solar PV at certain times or other non-dispatchable generators that are not burning any fuel…….you don’t burn fuel to create fuel, unless what you put in is a few % of what you get out, i.e. 10x or 20x, like with oil refining, where you burn oil/gas to refine other crude oil.
I am so glad you mentioned the Rough Storage facility. How many empty gas/oil wells are there in the North Sea that could be repurposed as hydrogen storage? After all they did contain huge volumes of natural gas at one time.
If we are spending money on converting methane gas to LNG for transport, can that invested energy be used better in a different process?
If we are going mad on CCS, how about using that investment to do the work on the technical feasibility studies that would be required to store hydrogen? Isn’t spending money on waste disposal the worst kind of waste?…..although is that needed for other industries?
OK how many empty gas wells are there that have
a) enough capacity
b) near enough to shore to reduce pumping costs/losses
c) the geology is OK for storing hydrogen gas
d) How many will we need to get the flow rate necessary to provide all the gas we would need at any instant for the different CCGT power stations.
e) Do any pipes need up grading in terms of capacity to get the flow rate to where it’s needed
f) The shift to heat pumps would be critical to
i) reduce the country wide demand for gas
ii) mean that we only need to pump 1.5x the volume of methane because we would be working at 200% combined efficiency of CCGT and heat pumps, lower flow rate would be needed to the country as a whole, but would need to have better flow to individual CCGT plants
g) Better house insulation to reduce demand……the best investment of all for efficiency.
h) Installing electrolysers at CCGT plants where they are sited on rivers gives clean water supply
i) it will be easy enough to pump the hydrogen either way through the pipes
So yes there will be additional costs, but how many of these costs already exist with using methane gas/LNG
We could be using 90% of what is already there, except the electrolysers, and a thorough trial of using old oil/gas wells as storage, and looking at pipe capacity
Would I construct a single storage tank – yes on site at the CCGT plants as a local limited store
Do we have to spill any hydrogen…..NO…..it all goes to the North Sea old oil/gas wells. If we get enough gas stored, the electrolysers can be turned off or wind turbines can be curtailed at certain times, but you would try to size each of the components appropriately. If we have enough old oil/gas wells. You don’t want to over invest…..that would be a waste too.
Yes the current storage is completely inadequate, which is why it would be one of the most important technical aspects to research and validate, apart from the high capacity electrolysis.
How much R&D expenditure goes into finding and developing new oil wells and gas wells? If that is rediverted into hydrogen storage in old gas/oil wells and electrolysis development/installation, once all the technical feasibility and development work is done, then if we actually get a stable system for the production and storage of hydrogen, wouldn’t we be spending less on the high risk/high cost aspects of oil and gas discovery?
How many 100s of millions are spent on oil/gas exploration, at what human cost, at what environmental cost?…….oil spills? there’s a lot of current expense that could be made superfluous……….100s of millions…….billions?…….if you’re not drilling and redrilling thousands of wells…….the oil and gas industry is starting to look very inefficient……have you looked at the current economics of oil and gas discovery and the whole industry?…….that’s what would be replaced to a large extent, possibly not entirely, but certainly downsized.
I do mean this, you don’t start diverting resources until the initial comprehensive analysis and trials are completed and the first store (redrilling/uncapping) of old oil/gas well is done and is up and running…….step by step.
It would need a total of several GWs of electrolysing capacity spread over several sites.
Oh and when you have proven the strategy, you can sell your services and products to foreign countries so that they can do the same thing if it is appropriate with their geology, whether in is off-shore or on-shore.
Do you think BP or Shell or any of the other majors would be interested?…….it would be their expertise that would be required.
Am I suggesting that this is the only method….NO, it can be one of many strategies that are used to provide fueling for CCGT plants….not all CCGT plants would have to work on hydrogen if other fuels were available, and if the CCGT plants are located near the North Sea it would be a better relationship……fewer/lower pumping losses, although, why not site the CCGT plants right above the stores, and then you just have one way pumping losses where you need the rivers for the clean water supply, but then the electrical losses would be higher, so swings and roundabouts.
Does that cover the broad technical approach well enough with proper thought about the challenges and specific aspects that need to looked at in detail?……without having to start working on the financial details?
Please don’t tell me that this is a worse idea than fracking say……..leaking methane, poisoned water supplies, tremors…..
As I said before, is this appropriate? Size matters, and if it is used to fuel 5GW of CCGT power plants output (50% efficient), say 20% of total CCGT capacity it’s 10GW less of methane that we would be burning.
If you are evaluating a strategy, you at least need all the components in place with a first analysis of sizing requirements and technical details to come up with the reasonable solution that does meet the specification that would be required. Then and only then can you look at costings, but again as I said before, you have to look at whole systems, including the savings and synergies that will be achieved with not having to spend so much annually on gas and oil exploration/oil field development.
You can’t just pick out say Rough Gas storage and say, sorry it won’t work, we haven’t got enough storage.
Of course surplus capacity doesn’t come for free, but again, oil and gas doesn’t appear in a fountain that magically finds its way to our country, there are huge costs that would be offset…….you have to do what is called a difference analysis, where you take the savings into account from other industries/processes and companies where there would be significant business changes.
Are you able to work with that complexity?……not looking at just one part of the whole picture?
If Shell or BP can’t get this running……yes you are right…..it won’t work.
Although, if they get fusion working……..would it all be for nothing?…….Fusion power…….the ultimate, or would it? What if there are some industries that need/will need hydrogen on a larger scale than now?
…anyone who thinks having lots of renewables on a grid is a good thing, needs to deeply understand why the Iberian grid crashed in May 2025, and took most of a day to recover…