
Since Friday’s blackout, there have been press reports that National Grid has presided over three “near-miss” situations where system frequency fell close to the lower frequency tolerance of 49.5 Hz, 1% below the target level of 50 Hz. National Grid responded to these reports, denying them:
“Contrary to media reports there have been no near misses nor early warning signs of incidents similar to last Friday’s power cuts. This was a highly unusual event, without precedent in the past ten years. We work with Ofgem to set the agreed limits of frequency of electricity output to keep the whole system safe and the lights on. All the time until Friday’s events, the system has remained within safe limits. We are conducting a thorough internal investigation and will report our interim findings in detail to Ofgem by the end of this week. We can and must learn lessons from Friday’s events – however rare their occurrence – as National Grid and as an energy industry.”
Analysis of frequency data
However, analysis of the frequency data from BM Reports from 1 May to 13 August found the following occasions when frequency fell close to the lower end of the tolerance band (in addition to last Friday):
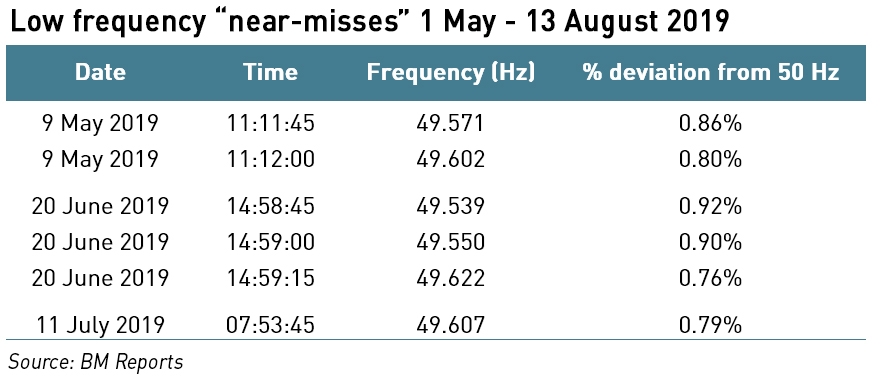
It’s possible there were other instances as there are some missing data from the series, specifically 09:26:00 – 13:49:45 on 22 May, 19:58:00 – 20:31:45 on 31 May, 09:26:00 – 11:05:45 on 6 June and 10:48:00 – 10:55:45 on 9 July. There were also several periods where the recorded frequency was zero, which is clearly erroneous.
National Grid may not consider being 0.92% below 50 Hz a “near miss”, and that might not be an unreasonable position – it would be difficult and time-consuming to try to unravel the exact state of the system at each of these times in order to assess whether the frequency drops observed were close to triggering load-shedding protocols.
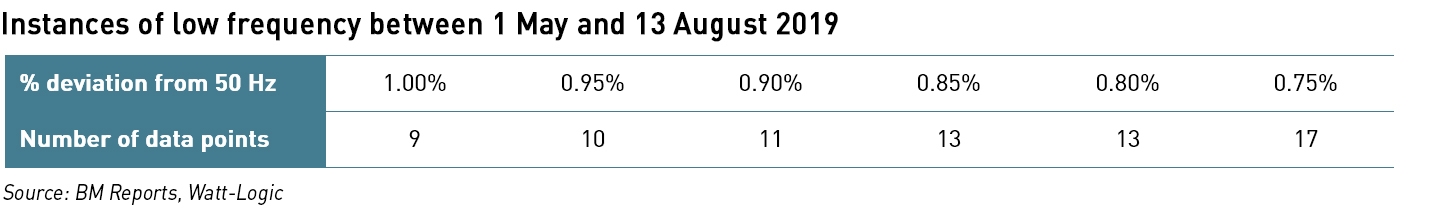
What my analysis did show was that these dips were unusual – there were over 600,000 data points in my spreadsheet but only 17 where the frequency was more than 0.75% below the 50 Hz level:
The question is whether these “near-misses” are signs of a growing trend as the proportion of renewable generation increases at the expense of traditional, primarily thermal generation. As I explained in my previous post, an increase in the amount of renewable generation impacts grid security in two ways – firstly by introducing more intermittency making it harder to balance supply and demand, and secondly by displacing sources of inertia which resisted frequency changes. Renewables currently do not carry out this function, although National Grid is exploring ways in which the role of renewable generation can be extended beyond the provision of energy.
Unravelling the blackout sequence of events
John Pettigrew, National Grid’s chief executive told Sky News that reports of “near misses” are “scaremongering” and that in his 28 years at the company there has only been one other time that two large generators had failed simultaneously. National Grid has also been denying that the wind levels were at all responsible for the outage, rejecting the link with high wind penetration last week.
However, there’s something off about the timings of these events. After publishing my post, I responded to some comments from readers and was prompted to look again at the sequence of events. It’s not straightforward to piece this all together because data are held in different places and may not always be precise.
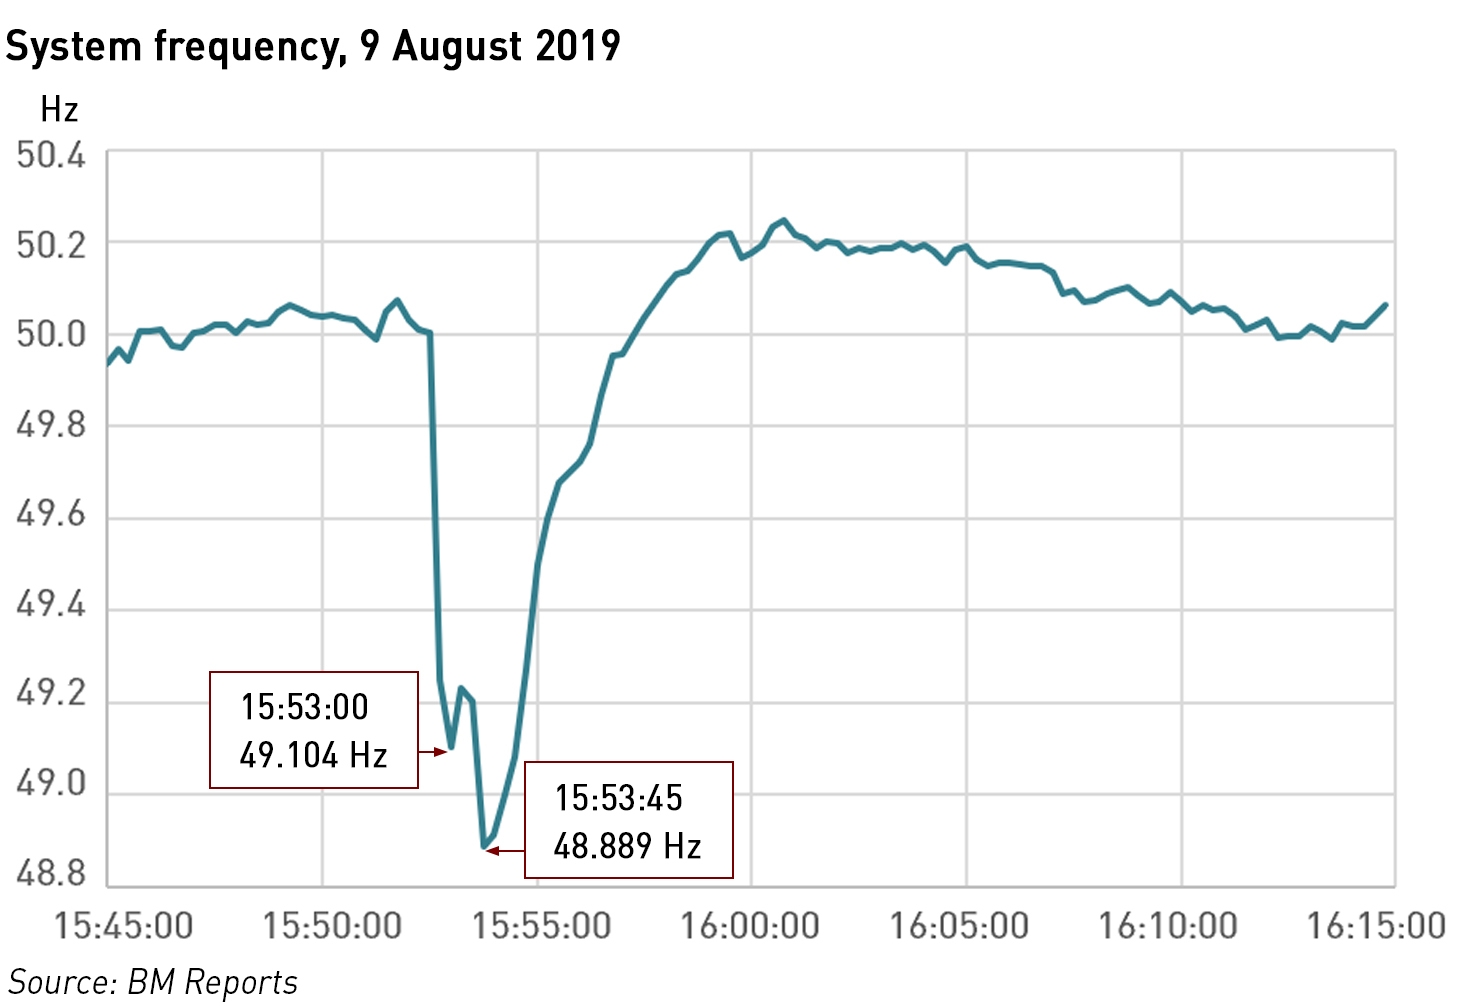
Assuming the frequency data are precise, the system frequency began to fall between 15:52:30 and 15:52:45 (frequency data are published at 15 second intervals).
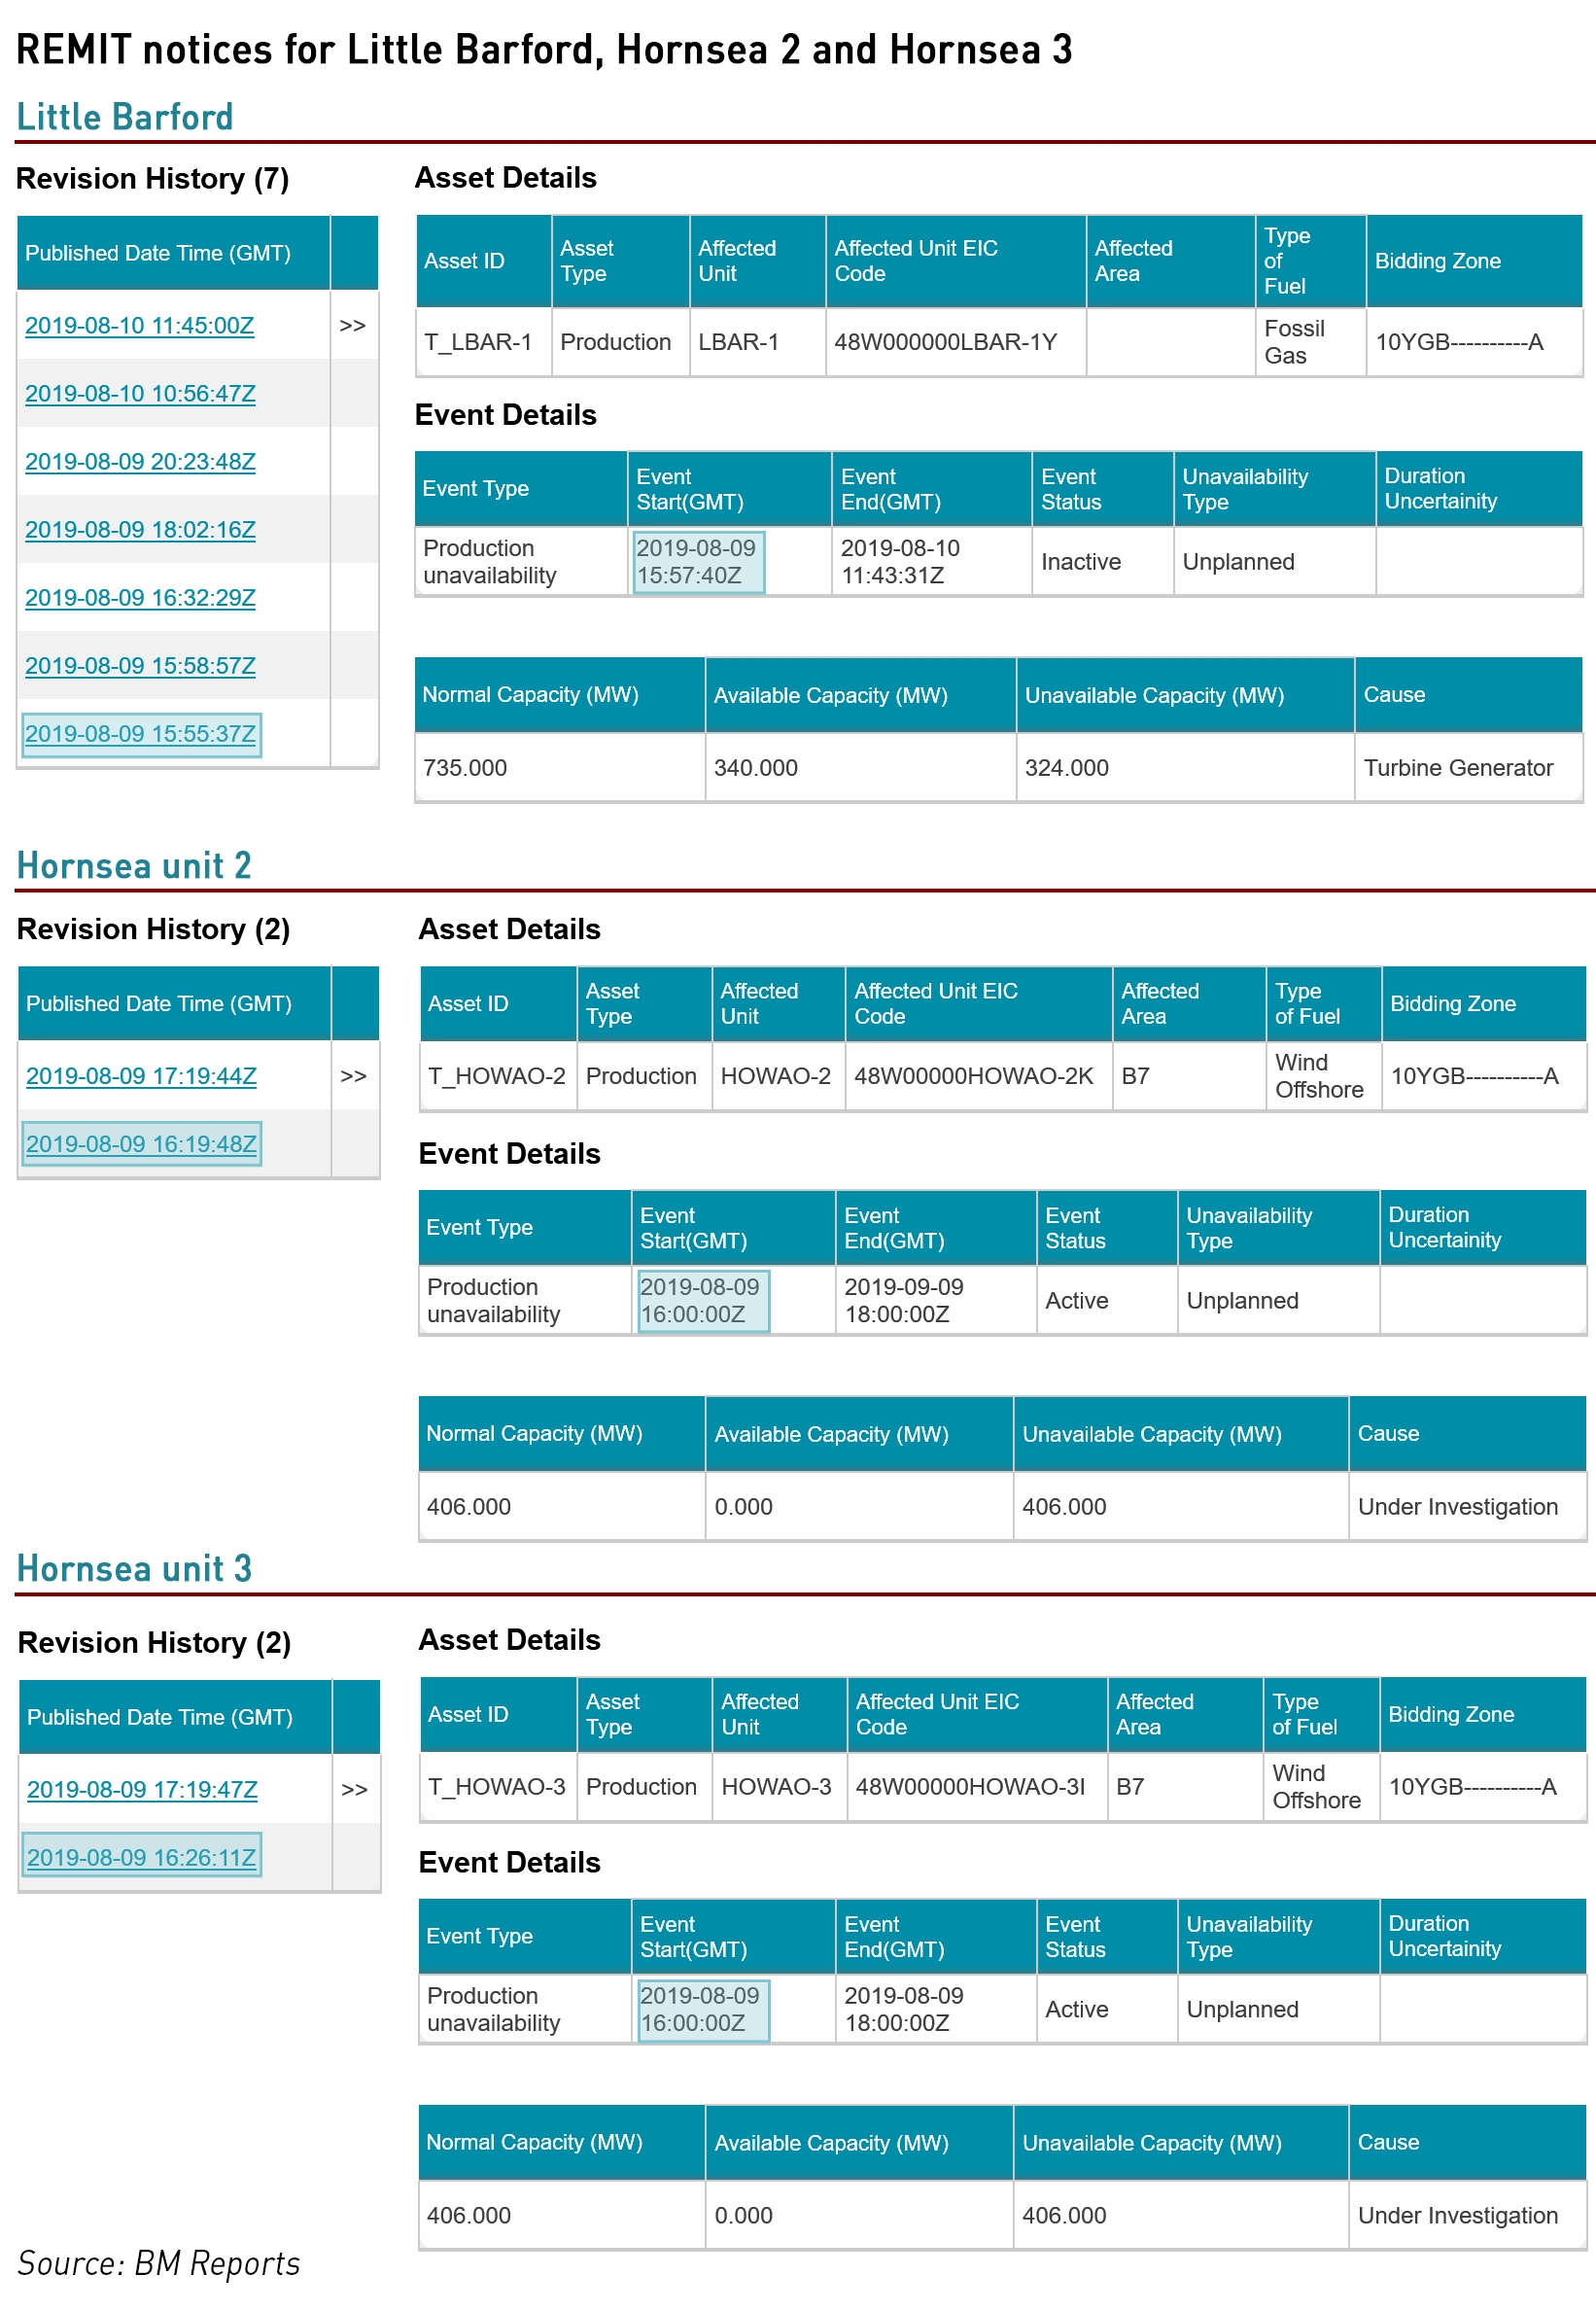
I looked at the REMIT notices to see when Little Barford and Hornsea went offline. RWE reported at 15:55:37 that it would go offline at 15:57:40…after the frequency has returned to normal levels. Orsted did not issue its REMIT reports for Hornsea until 19 and 26 minutes after the 16:00:00 published start of their outages, and although market transparency rules allow asset operators up to an hour to make their REMIT announcements, the start time is an unusually round number.
BM Reports also contains MEL (Maximum Export Limit) and FPN (Final Physical Notification) data – these are values provided to the system operator in respect of each Balancing Mechanism Unit (“BMU”) (in this case Little Barford, Hornsea unit 2 and Hornsea unit 3 are all BMUs), normally by the operator of the BMU indicating the amount the expect to export to the grid in each settlement period, and the maximum amount they could export to the grid. These data are to be provided before gate closure which is one hour before the start of the settlement period, and are manually updated by the trading teams meaning the are not always accurate if some unplanned event occurs.
The charts for Little Barford and Hornsea show the MEL falling at Little Barford while the FPNs are unchanged, and vice versa for Hornsea.
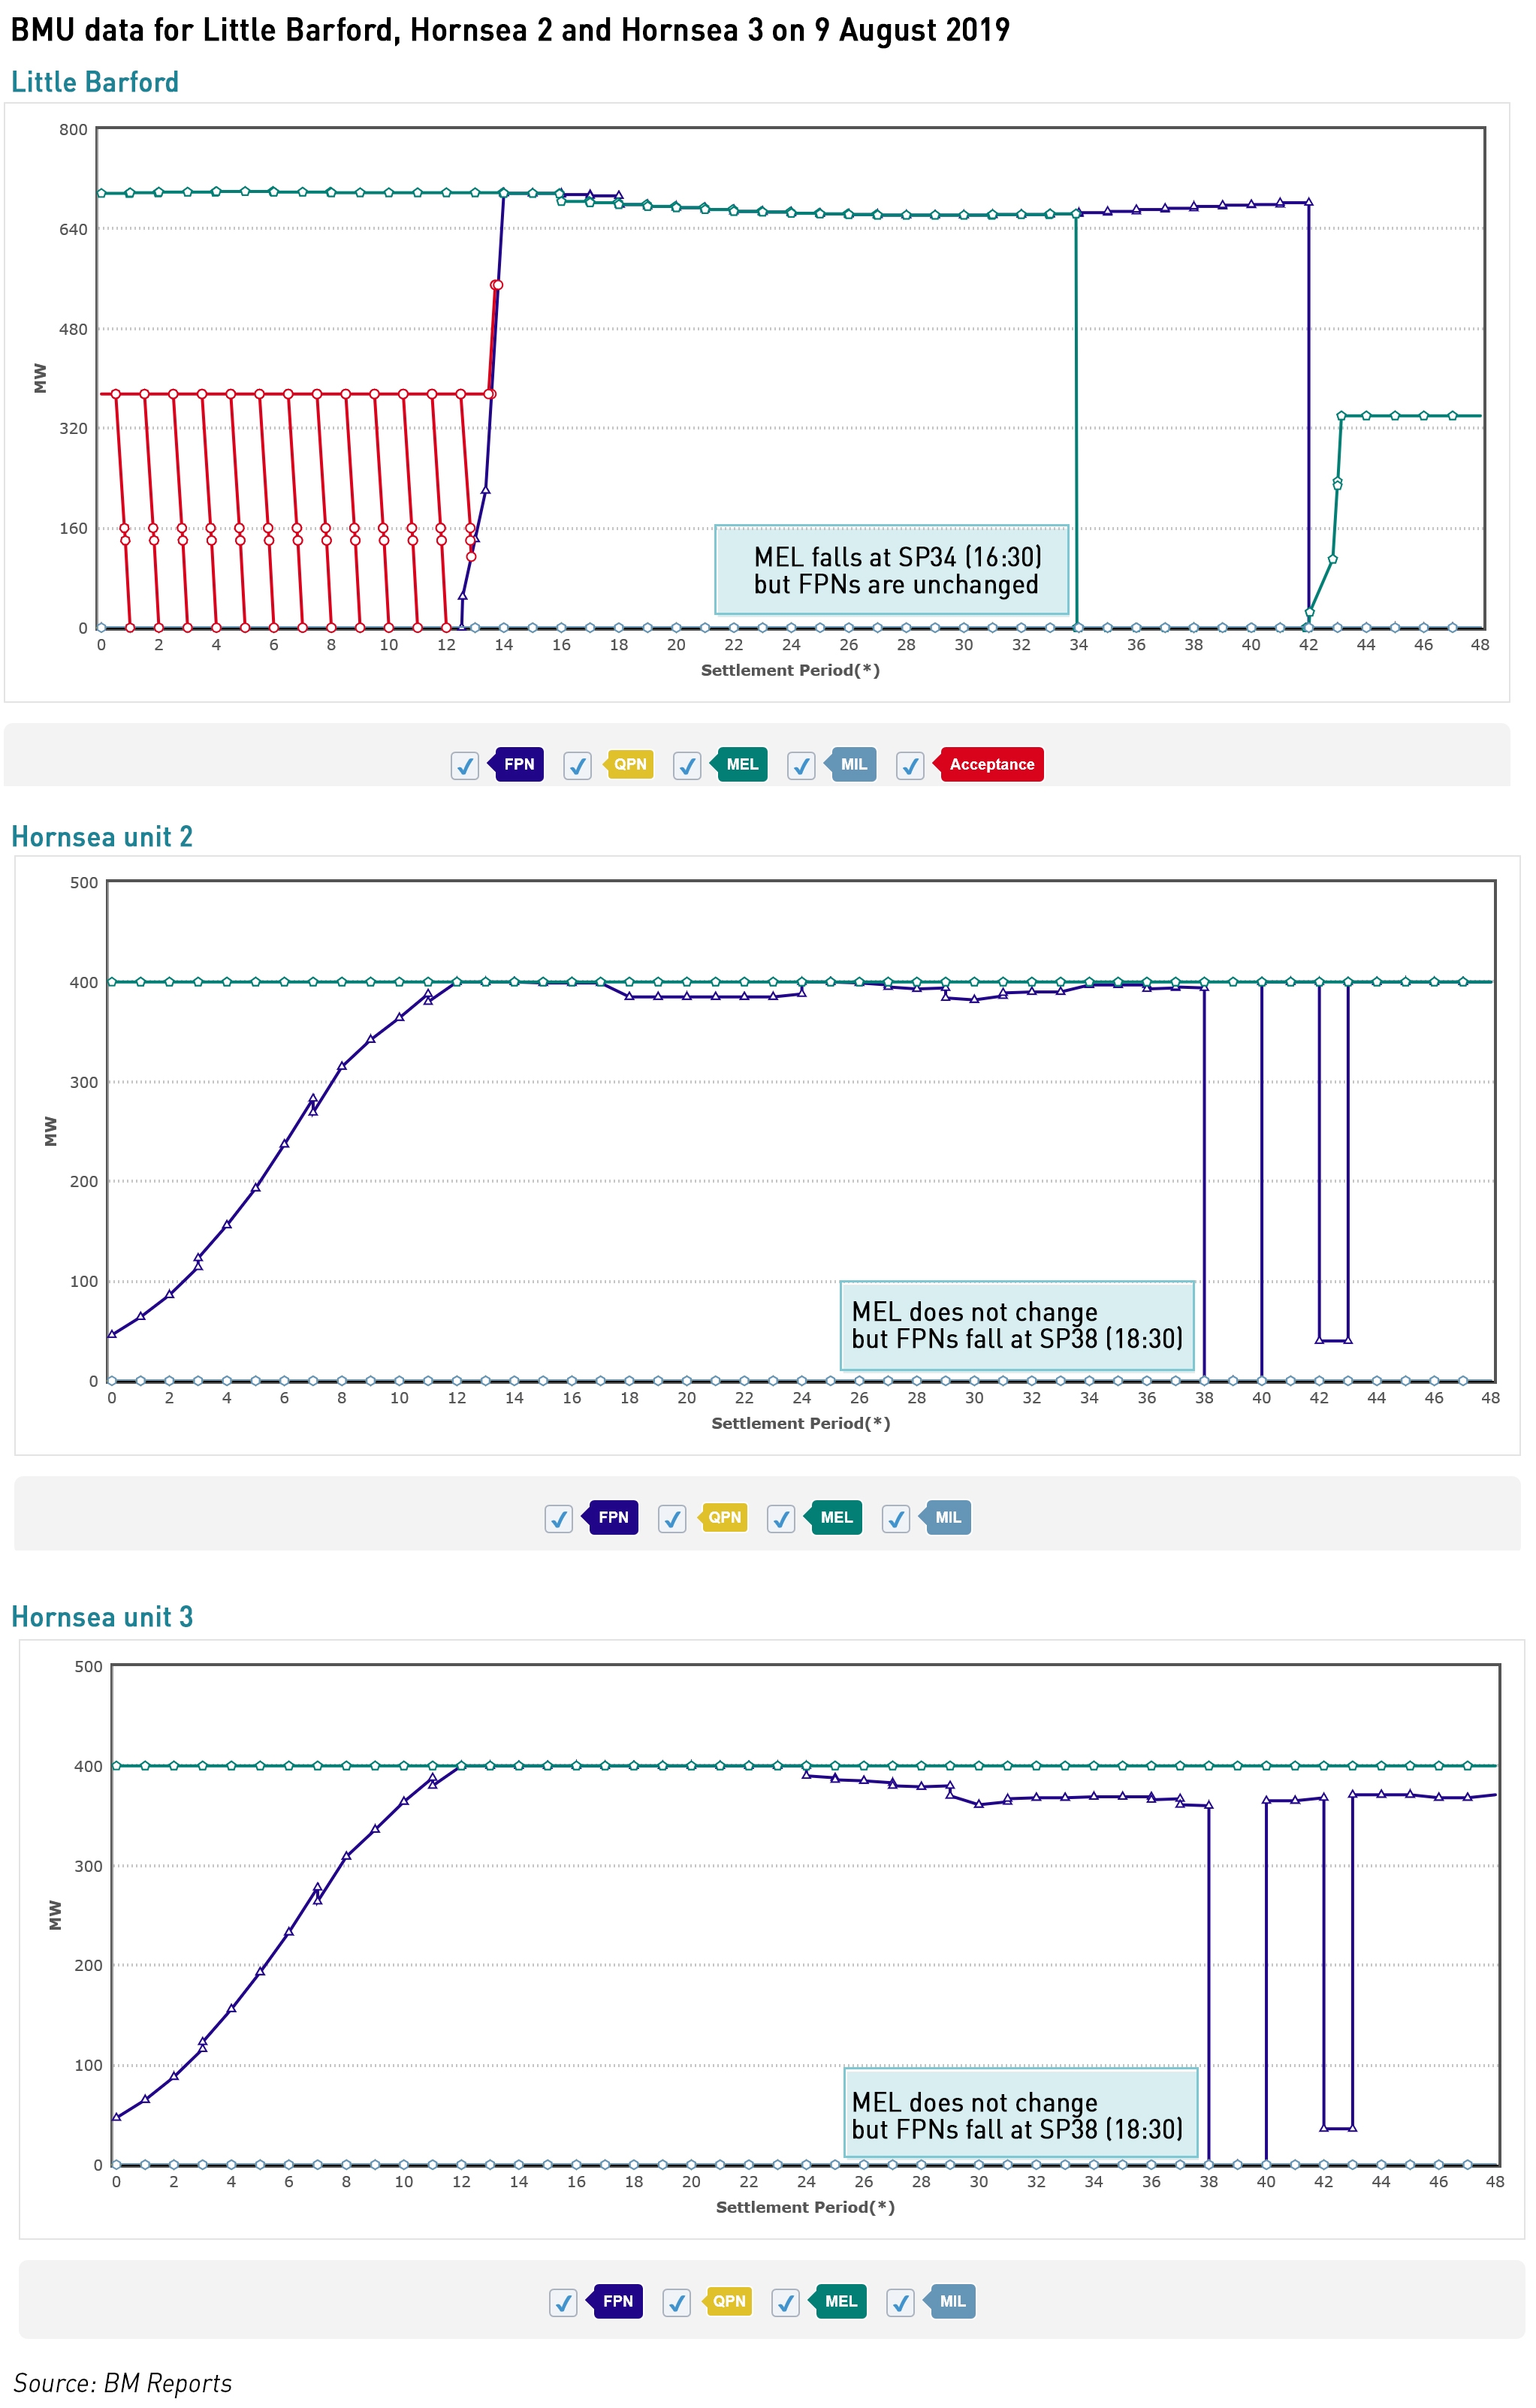
Understanding this picture is also not helped by the different time values used, with frequency and REMIT data being in GMT ie 1 hour before British Summer Time, and the BMU data being in settlement periods, where the first settlement period begins at 00:00 and are always in local time, ie currently in BST.
The table accompanying the BMU data on BM Reports has the corresponding times in GMT, and shows Little Barford’s MEL falling to zero at 15:57:00 – close to the time in the REMIT Report. The corresponding tables for Hornsea show the FPNs for both units 2 and 3 falling to zero at 18:00 GMT which does not match up with REMIT or any other data source.
Might high renewables penetration have been to blame after all?
The Little Barford data appear more credible to me – the REMIT notice was issued promptly and the BMU data are consistent with the REMIT data. However these show the plant coming off as frequency returns to normal levels after the drop. The Hornsea data on the other hand are not consistent and there was some delay in the publication of the REMIT notice (which still reports the events as being under investigation). While all the Hornsea data also show the plant coming off after the frequency recovers, these inconsistencies and delays make me more doubtful of the veracity of the outage timings.
There are 4 possible explanations of these inconsistencies:
- The frequency data are wrong and the drop in frequency occurred a few minutes later than shown in BM Reports, after Little Barford and Hornsea both went offline. I find this difficult to believe as frequency monitoring is entirely the role of National Grid and does not rely on inputs from third parties. It should be correct.
- Both Little Barford and Hornsea came offline earlier than reported, before 15:53, with their combined loss causing the drop in frequency. This would mean two different parties submitting inaccurate plant data and REMIT reports.
- One of the two power stations went offline before 15:53 and on its own caused the frequency to drop. Little Barford is too small to have this effect by itself, and normally, the loss of 800 MW of Hornsea would also not be enough, however on a day where there is a high percentage of renewables running and relatively low amount of thermal plant on the system, it might be the case that the size of loss that would cause a major frequency drop would be smaller.
- All of the data described here are correct and something else caused the drop in frequency. This is also unlikely, as it would mean some other large power station tripped, and someone would have reported this by now.
If option 3 is correct, ie Hornsea came off first and Little Barford only went offline after the frequency began to recover, this would mean the loss of 800 MW on a high renewables/low thermal day was enough to cause the frequency to drop outside operational tolerances. It is not unreasonable to suppose that the grid would become more sensitive to the loss of a generating unit when there is a high proportion of renewables on the system, and low levels of thermal generation which provides inertia.
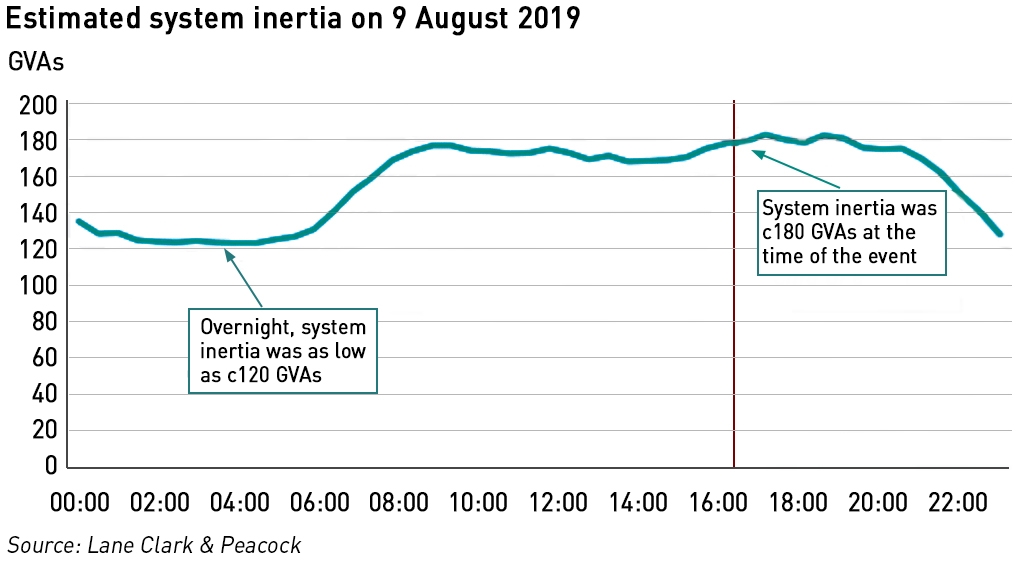
Interestingly, analysis from LCP indicates that system inertia was well above the levels (130 GVAs) that National Grid considers to be the minimum required for system stability. In fact, there was a period overnight when inertia fell below the safe level, but this was not the case at the time of the blackout. LCP suggested that the problems were compounded by embedded generators tripping off once the frequency fell, which might explain the secondary drop in frequency. LCP hypothesises there was a secondary event, but does not suggest what that might have been.
“National Grid should hold enough operating reserve to cover the “largest in-feed loss”, which is predominantly driven by large generators and interconnectors. However, with Little Barford’s 664MW trip and Hornsea’s 756MW trip followed by a secondary event there wasn’t enough time to catch the combined drop in frequency to prevent demand disconnections,”
– Kyle Martin, head of market insight at LCP
Historically, the grid protection measures have been sized based on the loss of the largest available units, eg the 1200 GW Sizewell B, but if the growing use of renewables is making the grid more sensitive, smaller losses might trigger the same load-shedding response. This would increase the risk of blackouts since there are many more generating units similar in size to the 800 MW lost at Hornsea on Friday, which underlines the need to ensure there is sufficient inertia on the system, alongside fast-acting frequency response services, able to react to such events.
Of course, this is just conjecture, because the official report into the blackout is not yet available, and what data are publicly available are inconsistent. It is to be hoped that the report provides a full explanation of the incident and the exact timing of events.
The sharp end of the energy transition
Earlier this year National Grid announced that it was ready to operate a 100% renewables system if enough renewable generation was connected. National Grid regularly and enthusiastically reports on the amount of zero-carbon generation running and recently started reporting on the carbon intensity of the electricity system. However, the security of supply obligation must not be neglected, and it is important that the system operator does not allow ideology to win out over physical realities. It is interesting that while trumpeting the high levels of zero carbon generation on Friday, National Grid did not draw attention to the fact that there was a coal plant also running during most of the day.
The speed of the energy transition has been unprecedented, and it would not be at all surprising if the rapid change in the fundamental shape of the grid did not present some difficult challenges around system stability. The analysis of frequency data between May and August this year, while a relatively short timespan (albeit 600,000 data points!) indicates that in fact National Grid is doing a good job of keeping things stable. It should not be afraid of being transparent about the problems on Friday, and if they are to do with the high levels of renewables and low system inertia, it should set out very clearly, the short and longer term options to avoid a repeat.
Greg Clarke recently announced the end of the trilemma – he was wrong – the trilemma is very much still with us, and National Grid is at the centre of it, trying to balance increasing amounts of renewable generation, without increasing its costs to unacceptable levels, whilst maintaining system stability. If Friday was a sign of the limits for renewable generation in the market as it currently stands, then the system operator needs to take a step back and focus on building the frameworks for running high levels of renewables safely even if that means curtailments and keeping more coal on.
Very very interesting. Understanding this blackout could then tell us so much about the level of penetration that renewables can actually have in the UK grid and how we should cope with it. Looking forward to hear what you think when the official report comes out.
Could this mean that more spinning reserve is needed at times when high levels of renewables are on the system ?
A costly remedy.
In the meantime thank goodness for gas, a limited resource.
The burning of this refined fuel for electricity generation was always questionable, as it could be used directly in most applications; we are burning an awful lot at the moment.
Not forgetting the nuclear contribution quietly looking after our base load demand, 24/7, 365 days a year.
As intended, always needed & carbon free.
Another lifeline may be the various connections to our near neighbours in Europe, currently well under way; ie 2nd link to France, Belgium, Norway & Denmark.
However this means being reliant on others…….Barry Wright.
Indeed – when you look at solutions like micro CHP, you can see how much is lost in terms of fuel efficiency by burning gas in power stations rather than in the home. Unfortunately the upfront costs for households are still too high, but it would be useful to see if subsidies could have the same effect on lowering costs as they did for solar.
The forthcoming closure of the entire coal fleet and much of the nuclear fleet may well be vrey problematic and I’m not at all convinced of the benefit of interconnectors. Connecting with Scandinavian markets where the weather correlation is lower does make sense, however linking with France in particular is of little benefit…the French electricity system is far more temperature sensitive than ours meaning at times of peak winter demand we often find ourselves exporting to France rather than importing. This is effectively a 4 GW deficit as instead of receiving 2 GW of imports, we export 2 GW.
I would like to see new nuclear being approved, in particular the Wylfa Newydd project, and I think inevitably we’re going to need more gas since it can be built quickly and at comparatively low cost.
Mornin’ Kathryn……massive apology for my error re missing post……yours grovingly…..Barry Wright.
I worried when I saw your earlier comment thinking my firewall must have it in for you in some way!
I’m afraid I had not been visiting your blog recently while recovering from some surgery. However, I see you have assembled many of the pieces to try to analyse what happened. At this point, we still don’t know some crucial details. I spent quite a bit of time trying to piece it all together, commenting at various places (NALOPKT, WUWT, Tallbloke, Jo Nova among them – I wish that Euan Mearns still was running posts at his site – it attracted some extremely high quality comment from knowledgeable people). Key was getting hold of a 1 second based frequency chart that was tweeted out by Upside Energy, a a small outfit that specialises in grid services aggregation – their operation produced almost 6MW of response within a second which they held for about three minutes before scaling it back as frequency returned to normal. Their chart is here: https://pbs.twimg.com/media/EBiv7jxXUAM5KZl.jpg:large
I trust the frequency data because it doesn’t lie about the timings of major trips, quite unlike Hornsea. I’m surprised that you report that the Grid Code allows them as long as an hour to report market sensitive inside information, but I’m sure you’re right. When I saw their REMIT reports, like you I was immediately suspicious – why report the outage as at the start of the succeeding settlement period, and not do so until almost half an hour after the event if there are no motivations of attempted cover-up (possibly involving collusion with National Grid)? Little Barford got its report out very quickly, complete with a schedule of post event availability with ramp up timing, and it’s perhaps a little easier to excuse the mistake in the actual time of shutdown. I thought that Hornsea might have a case to answer under clause 4.2 of the REMIT regulations, which only grant an exemption to prompt reporting in exceptional circumstances provided there is no attempt to mislead or take undue advantage, and provided that the reasons for doing so are reported promptly to OFGEM and ACER.
My gut feel was that the Hornsea trip was first, partly because 5 minute data from Gridwatch and BM Reports showed a ~850MW drop in wind generation, but only a rather smaller drop in CCGT – so I assumed that Little Barford wasn’t running flat out. The oddity is that these drops occur after the frequency event, which has led me to question what the data published at each time stamp really show (spot or average, covering data from when exactly, bearing in mind that aggregating data from wind farms and Sheffield’s solar estimates may not be quite as speedy as from a couple of dozen major power stations. 5 minute data is not adequate to distinguish events – the frequency chart is a much better guide. We can see that the trip started at 15:52:34Z, reaching the first nadir at 15:53:00Z, with the curve turning down again 10 seconds later, reaching the true nadir at 15:53:50Z at which point the 48.8Hz load trips were triggered. by 15:55:00Z frequency had regained the 49.5Hz statutory minimum, and it was within 50+/-0.2Hz normal operating range 2 minutes later, followed by a period of over frequency partly motivated by the need to catch up and be able to reconnect loads.
I initially wondered whether the loss of Hornsea might have helped trip Little Barford, on the basis that there would have been major flows South from Keadby past West Burton on down to Eaton Scoton (where Little Barford connects to the 400kV line and down to London). Loss of power input to the line might have left Little Barford seeing the demand increase first, and led to a disproportionate drawdown of inertia that would have tripped it out for risk of islanding. More recent information confirms there were thunderstorms in the area, and a lightning strike does seem quite probable as a cause of a trip. Meanwhile the frequency data make it quite clear that the entire output from Hornsea was lost instantaneously, pointing to a fault in either the onshore or offshore substations rather than any problem with wind generation.
I did check the weather reports for the Humber area, which showed steady winds of about 45kph gusting 60kph – some way below the 90kph/25m/s at which wind turbines start tripping out. In any event, I found that Siemens Gamesa bragged about the High Wind Ride Through feature of their turbines that is designed precisely to avoid large simultaneous drops in generation – and given that Hornsea 1 covers some 407sq km, it is obvious that a high speed gust would take several minutes to travel from one side to the other. I was misled in part because I found no thunder reports for that part of the country. It was only much later that I found blitzortung.org and its historic maps of lightning, setting up 15:55UTC 9th August to see the thunder in the St Neots area in the previous 20 minutes as a mass of crosses in white.
We do have an admission from Hornsea that their substation wasn’t correctly configured and that led to the trip – and they have now reconfigured it. The detail has yet to be made public. I did note that on the Saturday, Hornsea produced 780MW absolutely consistently across the 48 settlement periods, slightly down on the levels immediately before the trip of about 830MW (the as yet small HOWAO-1 bank was never reported as tripping – only bank 2 and 3). I see that the FT has suggested that perhaps after all, Hornsea was the first to trip, based on some sneak peek at National Grid’s initial report to OFGEM.
REMIT also showed the Grid imposing a 931MW demand reduction from 15:54:00Z to 16:40:00Z. That is, starting some 10 seconds after the trips began. A big question here is why there was insufficient spinning reserve to rescue the situation within the time allowed by inertia without resorting to load shedding. Supposedly the report shows they had only 1GW lined up – and Dinorwig/Ffestiniog pumped storage only ran up from just under 300MW pre event to under 1 GW post event as a peak. There was spare capacity there in principal, even though some of the Scottish pumped storage was out for maintenance. Perhaps part of the problem is that if you lose supply meeting demand in the London area, you need to find a way to route any extra generation to the demand that doesn’t breach transmission constraints. If links are already running at capacity e.g. transferring wind South via Western Link HVDC, it’s hard to see how you could get Dinorwig’s full output through the grid towards North London. The planned contingency will surely be for the loss of interconnectors that feed in from the South. However, you can rebalance the grid more easily if you load shed to remove transmission constraints. Londoners may be smug about having no power stations or wind turbines in or around the capital any more, but they pay the price in events like these. Grid transmission constraints seem to be a feature of high renewables production even when overall demand is a modest 30GW, with so much power having to flow Southwards.
I’ve checked the complete generation profiles of Hornsea and Little Barford over the 1-10 August period on half hour settlement data. It’s clear that Hornsea had been halting operations usually a bank at a time, but also the whole wind farm for a number of hours of the 8th, for tie-in work as they install the more turbines – and quite possible they made a mistake (left a monkey wrench on a ledge that fell into a circuit breaker?? – a literal spanner in the works!!) while doing so. Little Barford was operating at close to full output during much of the day, with two modes. One appears to show a small dip in output nicely matched to a solar output curve during the day, and another shows a more jagged profile of demand response at the margin. Overnight, they ramp down gently to half throttle before ramping up again from 6 a.m. They did have a complete shutdown for the 6th until 6 a.m. on the 7th. Ramp rates up or down are mostly below 10 MW/min. Very different to a trip of 664MW in a second.
This does allow us to solve one mystery – the clue was the quoting of RWE’s head of PR in Germany, Lothario Lambertz. I can imagine what happened: Bloomberg contacted RWE for comment, and went straight to the head of PR in Germany. He will have said “I’ll get back to you – give me five minutes.” He will then have rung his senior management pal (likely another German) in the UK on his mobile and asked for comment. He would not have been aware of the incident, but almost certainly knew that Little Barford had a contract that allowed the Grid to ramp down its output at the 23GW level (which he might even have negotiated or at least signed at a swanky lunch), and mentioned it. Meantime, the Bloomberg journalist rang back, pressing for info. So it was given out. Probably the UK manager had no clue how to contact the ops room for the real story, and neither did PR in Germany. Besides, mere operator underlings are not to be trusted! Corporate silos can be wonderful things at times.
Demand drops through 23GW typically after 11p.m., and demand was running at around 30GW: the story is a red herring.
Incidentally, there is a very good report on the 2008 incident which also caused 48.8Hz trips and will ring many bells here
https://web.archive.org/web/20100206093023if_/http://nationalgrid.com/NR/rdonlyres/E19B4740-C056-4795-A567-91725ECF799B/32165/PublicFrequencyDeviationReport.pdf
My initial conclusion is that the Grid were running in a risky configuration because they were pursuing renewables and wind records (about which they had been boasting before the event) – possibly with the agreement of OFGEM, BEIS and at least the previous ministers. It is a matter of simple fact that there was inadequate inertia and spinning reserve to prevent load shedding, and it seems likely that transmission constraints and the remote location of power stations and pumped storage from demand were a factor in the inadequacy of the response.
Of course, extremely expensive battery projects will push for funding. The problem is that if you want to supply 2-3GW to cover rising interconnector risks and oversized wind farms losing a transmission link to shore it’s an horrendous cost when they can only ever earn their keep when major transmission losses occur: the market for normal ancillary frequency services is only a few hundred MW at most. It’s much, much cheaper to run CCGT to provide sufficient inertia and spinning reserve in the first place.
Sorry to hear about your surgery – hope ypu’re all recovered…
Thank you for your detailed comment. It’s been quite had to try to unravel what happened from public information, particularly as most commentators accepted NG’s original narrative that LBAR came off first, the Hornsea and then the frequency fell, which is simply not supported by that available data. Whatever emerges as the true sequence of events, I think this needs to trigger a tightening up of the reporting rules so that the data do line up with events, perhaps after a short revision period.
I looked at Upsde Energy’s chart – in fact I had it in the original version of my post on the blackout – however I decided to base my analysis on official data on the basis that I knew its provenance and so the point about data incobsistencies couldn’t be lost in a debate about the source of the data.
It will be interesting to see why Hornsea tripped. I can well imagine that a large new windfarm with relatively new turbine technology (the 7 MW model) would have some teething problems, so the cause could have been human error (the spanner), poor configuration of offshore connectivity, or something to do with the behaviour of the tubines in the prevailing weather conditions.
I agree with your assessment about the overall grid configuraion though, and your point about constriants is well made. I think NG was absolutely sailing close to the wind (pun intended!), and it may well have been pushing the boundaries for a while to see what it can get away with. That said, looking at frequency data for the past 3 months at least shows that they really haven’t been taking major risks, so there will be an element of bad luck here. The point is that NG needs to take a fresh look at what the sensitivity levels are in a heavy renewables / low interia context and whether previous assumptions about what can trigger a low frequency event need to be revised.
That brings me on the the next point about inertia. NG doesn’t publish inertia data, so I used the LCP analysis, which actually showed that system-side inertia was fine at the time of the outage. This would suggest that constraints played a much bigger role than is typically mentioned. When deciding how much frequency support services it should procure, it will need to be looking carefully at where those servcies are located.
I also agree with your point about batteries…developers of battery projects think they are the best solution to every problem, but you can’t build a business case around a once-in-a-decade event. It seems inevitable to me that we will need more CCGTs if you look at the coal and nuclear capacity that is going to come off in the next few years, so that will provide the added benefit of reliable frequency support. They could (should) also look at whether the retiring coal turbines can be re-purposed to provide inertia as synchronous condensers.
One of the things I notice about frequency data is that National grid still haven’t published any detailed 1 second data beyond that for April. The monthly 1 second data requires special software to read it: at 30 or 31x24x360~=2.6 million lines it’s beyond my spreadsheet (which handles over 1 million lines) to handle directly. The 15 second data may hide some deeper nadirs. With the aid of a large file editor, I was able to paste in April a million lines at a time, and found one event down to 49.611Hz, and another down to 49.700 Hz. The grid spent about 630 seconds outside the normal operating range of 50+/-0.2Hz during the month. I haven’t looked back at earlier months.
Looking at the Upside Energy chart in graph digitising software, I reckon that the initial RoCoF was over 0.125 Hz/sec (it took about 4 seconds to drop 0.5Hz, so the first second would have been faster). The Grid did an interesting presentation back in late 2016
https://www.nationalgrideso.com/document/14151/download
If you look at slide 3 you will see that that was the highest level they had seen that year, reflecting 135GVA.s of inertia and a maximum loss of 680MW.
Looking back at some of the other incidents you highlight, I conjecture from Gridwatch 5 minute data that the 9th of May was due to unexpectedly rapid ramp down of the NEMO link (or maybe it was a planned test of consequences, with Dinorwig ready to go to make up the difference?) – it had been running as high as 982MW, and was reported at 0 ten minutes later and may have tripped out completely (again questions about what the data really represent and timestamps): there was some 20.7GW of CCGT. 20th June appears to be the loss of ~750MW of CCGT due to a trip (which can of course be on a transmission line or substation rather than the power station itself). It would take a lot of effort to pin down the actual station involved, but there was 14.9GW of CCGT at the time. 11th July appears to have been another big CCGT trip – 1.1GW, but out of 21.5GW of CCGT operational, illustrating the advantage of inertia in containing the problem. Of course, inertia isn’t confined to CCGT, but it is the big variable. The thing about these events is that they allow the Grid to understand how the system really behaves, and therefore to make better predictions about the risks being run with low inertia configurations.
One other thought. I wonder if it will turn out that rail companies agreed to be in the 48.8Hz tranche of load shedding in exchange for lower power prices, having been misled about the risks? I think of the many companies that used to go for interruptible gas contracts because of the high premium attached to meeting peak demand. Of course a low inertia trip is most likely in periods of lower demand, as the National Grid reminded us in its Summer Outlook 2019.
Key messages – electricity
• Low transmission demand and high volumes of low inertia generation can cause operational
issues over the summer.
• We will need to take day-to-day actions to manage system frequency in times of low demand. Usually this will involve working with flexible generation to reduce supply.
Like the Irish, they know they should be curtailing wind to cut the risks. Say one thing and do another.
I’m not sure the railway companies were necessarily misled about the risks…they might have been told that this could happen once every 10 years or so and been OK with that thinking it would get lost in the noise when all the other major rail disruptions are taken into account. Particularly when most people might think from the news that a widepread blackout is not the fault of the railways and so would place the blame elsewhere.
The interesting thing about curtailments is that the press has picked up on this over the past few days, and in particular curtailment payments to Hornsea. Part of me sympathises with NG because managing this transition is not trivial and balancing the competing pressures of the trilemma is difficult. The cheerleading for zero-carbon is starting to grate and definitely undermines the sympathy I have for them, but possibly if they didn’t sound supportive of ZC then people might accuse them of undermining climate goals, particularly when they start making curtailment payments which the man-in-the-street might struggle to understand. The wider press reporting of energy is generally sensational and badly informed – I literally cringed when reading about how “surge pricing” would make our Christmas lunches more expensive to cook!
Hi again
“I would like to see new nuclear being approved, in particular the Wylfa Newydd project, and I think inevitably we’re going to need more gas since it can be built quickly and at comparatively low cost”
I totally agree, nuclear has got be part of the energy mix to service our national base load demand.
I personally feel that the privatisation of nuclear generation was a bridge too far; I fear this is beginning to emerge ?
The Moorside plant in Cumbria another project on hold with an uncertain future was I thought an ideal location with fuel reprocessing facility next door at Sellafield thus relieving the need to regularly move sensitive high grade waste on our public transport network.
I’m sure the nuclear industry with lengthy payback times, is well beyond business & needs to be back in the public sector owned & adequately funded to cater for our future energy needs.
In my local area we have Heysham nuclear plants 1 & 2, the former soon to cease generation & be decommissioned.
Adjacent land is available & a nuclear licence is in place for a new Heysham 3.
There is robust infrastructure to accommodate the generation output from such a new power plant.
Just get on with it asap would be my message before the well worn cliche “keeping the lights on” fails to apply…..Barry Wright.
The first report from National Grid to OFGEM is now public
https://www.ofgem.gov.uk/system/files/docs/2019/08/incident_report_lfdd_-_summary_-_final.pdf
At 4:52pm there was a lightning strike on a transmission circuit (the Eaton Socon – Wymondley Main). The protection systems operated and cleared the lightning in under 0.1 seconds. The line then returned to normal operation after c. 20 seconds. There was some loss of small embedded generation which was connected to the distribution system (c. 500MW) due to the lightning strike. All of this is normal and expected for a lightning strike on a transmission line.
However, immediately following the lightning strike and within seconds of each other:
• Hornsea off-shore windfarm reduced its energy supply to the grid
• Little Barford gas power station reduced its energy supply to the grid
The total generation lost from these two transmission connected generators was 1,378MW. This unexpected loss of generation meant that the frequency fell very quickly and went outside the normal range of 50.5Hz – 49.5Hz.
The ESO was keeping 1,000MW of automatic “backup” power at that time – this level is what is required under the regulatory approved Security and Quality of Supply Standards (SQSS) and is designed to cover the loss of the single biggest generator to the grid.
All the “backup power” and tools the ESO normally uses and had available to manage the frequency were used (this included 472MW of battery storage). However, the scale of generation loss meant that the frequency fell to a level (48.8Hz) where secondary backup systems were required to disconnect some demand (the Low Frequency Demand Disconnection scheme) and these automatically kicked in to recover the frequency and ensure the safety and integrity of the network
This system automatically disconnected customers on the distribution network in a controlled way and in line with parameters pre-set by the Distribution Network Operators. In this instance c. 5% of GB’s electricity demand was turned off (c. 1GW) to protect the other 95%. This has not happened in over a decade and is an extremely rare event. This resulted in approximately 1.1m customers being without power for a period.
The disconnection of demand along with the actions of the ESO Control Room to dispatch additional generation returned the system to a normal stable state by 5:06pm. The DNOs then commenced reconnecting customers and supply was returned to all customers by 5:37pm.
…
At 16:52:33 on Friday there were a number of lightning strikes on the transmission network north of London. This triggered the transmission line protection to disconnect and clear the disturbance (in c.70milliseconds) plus initiate its subsequent reconnection (automatically after c.20 seconds). This operated as normal and the voltage disturbance on the network from the lightning was within expected limits for such an event.
As would be expected in such circumstances there was the loss of some small embedded distributed generation (totalling ~500MW) associated with the transient voltage disturbance caused by the lightning.
Almost simultaneously, and unexpectedly, two large transmission connected generators reduced their output onto the system.
…
Power Loss
• The lightning strike and rapid frequency fall caused the loss of ~500MW of Distribution connected generation, likely to be solar and some small gas and diesel fired generation, due to the operation of the generation sources own protection systems (Loss of Mains Protectioni)
• Hornsea One offshore wind immediately lost Hornsea modules 2 and 3, totalling 737MW. Module 1 continued to operate smoothly at 50MW throughout the event.
• Little Barford Gas Power Station – near immediate loss of the Steam Turbine unit (244MW) and then, as a result of the loss of the steam unit, loss of the two Gas Turbine units (total station loss of 641MW) over the following 90 seconds.
For an amateur sleuth, I didn’t do too badly, did I?
Absolutely, but what really disappoints me is that the clues were in the data but so few people are willing to really look at them. Even though the data could be A LOT better, what was available didn’t add up (!) … I’m still suspicious about what happened at Hornsea, and why it reacted so dramatically to an event miles away when no other plant did apart from LBAR which was just down the road. The loss of embedded generation was much bigger than I would have thought, so that bears some thinking about for the future.