Is NESO struggling to manage the grid this summer? In addition to multiple market warnings in the past couple of weeks, there was a significant low frequency event that went largely unreported although has been the subject of much discussion within the industry;.
Over the past week GB system operator NESO has issued two Electricity Margin Notices (“EMNs”), something that has never been done in summer before. These were issued on 24th and 26th June. On both days, and the following Monday (29th) NESO was required to seek permission from the EU to breach intraday interconnector trading limits in order to balance the grid.
These limits were imposed on 20 May and NESO to a maximum of 1,500 MW per settlement period across all interconnectors. This places a volume restriction on NESO’s ability to buy or sell interconnector capacity within day when the market trades are against the interests of system margins.
However, the bigger issue is what happened on 23 June, when no EMN was issued, but a prolonged low frequency period in the evening suggests that it should have.
Low frequency observed over the evening
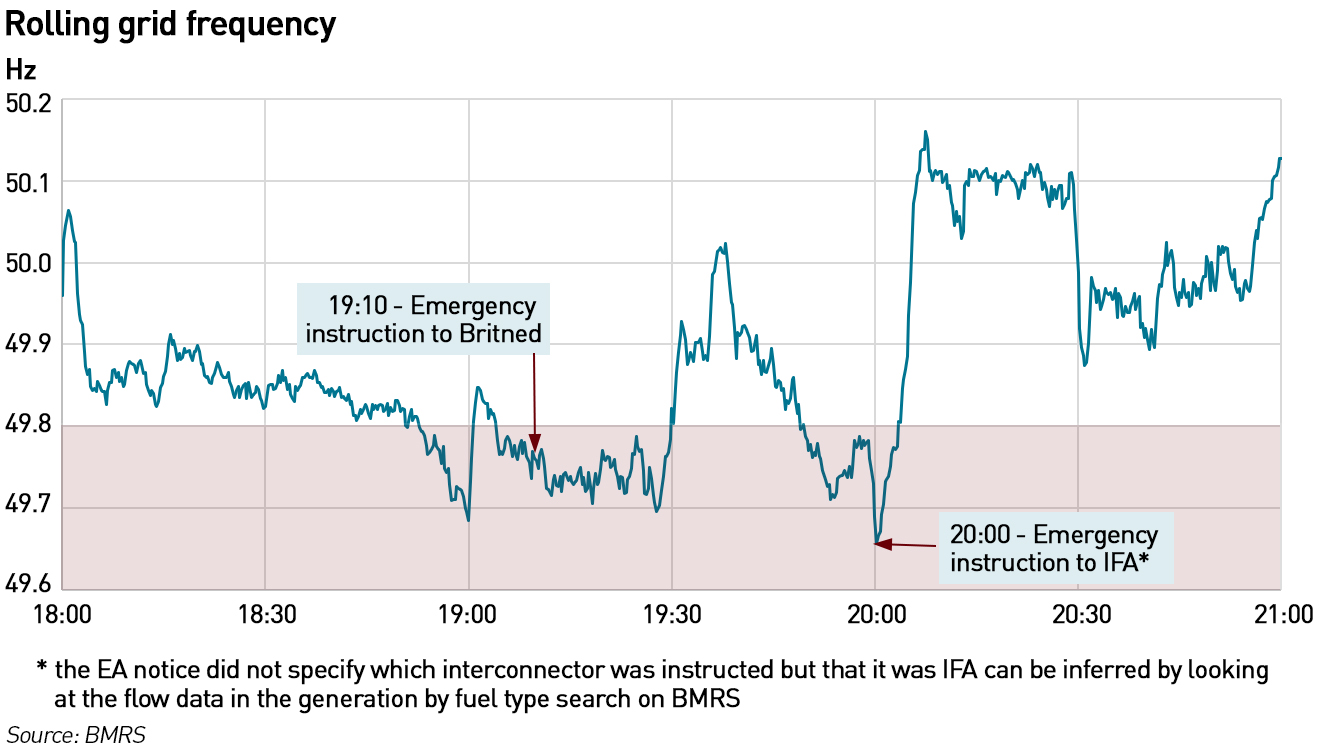
Unfortunately, granular data are not published to the NESO Portal until after the month end (usually around a week after for frequency data) so I can only use the 15 second data from BMRS. These indicate that grid frequency was below the safe operational limit of 49.8 Hz multiple times between 18:30 and 20:30:
So what caused the frequency to fall so low and why was an EMN not issued for 23 June? Frequency falls when demand exceeds supply, so this period of low frequency indicates that demand was higher or generation lower than expected. Wind output was certainly low on 23 June, and solar generation falls dramatically through the early evening despite sunset not being until 9:35pm.
NESO is bad at forecasting demand
The key is likely to be found in the demand forecast, as this is a known weakness for NESO as I have previously described here and here. I have shown that between 1 November 2024 and 1 December 2025, the average error of the NESO forecast vs NESO version of INDO was 675 MW (679 MW vs BMRS INDO) and the maximum error was 4,931 MW (5,712 MW vs BMRS INDO).
For some reason some of the NESO outturn figures did not match the Initial Demand Outturn (“INDO”) value reported by BMRS. INDO takes into account transmission losses but does not include station transformer load, pumped storage demand or interconnector demand and is the metric NESO uses for demand forecasting.
These are really significant errors – the average demand per BMRS which ought to be the official record, was 26,422 MW, so the average error was 2.6% of demand and the maximum error was 12.5% of maximum demand.
When comparing the error in any given settlement period with the demand in that period, the errors are up to 22.7% of demand. These errors are very significant. An error of 5.7 GW is more than 4 times higher than the SQSS – the amount of reserves NESO is required to hold to protect against the loss of the largest infeed to the grid. This means that a forecast error of this size on a tight day would overwhelm the system. (A forecast error isn’t an SQSS event, but if there were such a large error on a tight day the reserves held against an SQSS event wouldn’t be enough to cover it meaning the system could be short even without the loss of a large infeed.)
The real problem could be even worse – NESO does not balance the grid in half-hourly intervals, it balances it from moment to moment. If the average error over 30-minutes is so large, the 5-minute or 1-minute error could be even larger, which poses a real threat to the grid.
“Unless its forecasting improves, NESO might just run out of luck one day, triggering a blackout. Plus, NESO should benchmark its forecasting performance against actual final outturn rather than INDO which is the initial outturn,”
– Watt-Logic: 2025: the year energy security threats began to manifest
So what did the forecast error look like on 23 June? The answer is not good. From 8am onwards, realised demand was higher than forecast demand and was over 1,500 MW late afternoon. The SQSS requires NESO to hold reserves against the single largest infeed which is 1,400 MW, so the actual demand forecast error on 23 June was larger than the amount of reserves NESO had in hand under its system security obligations.
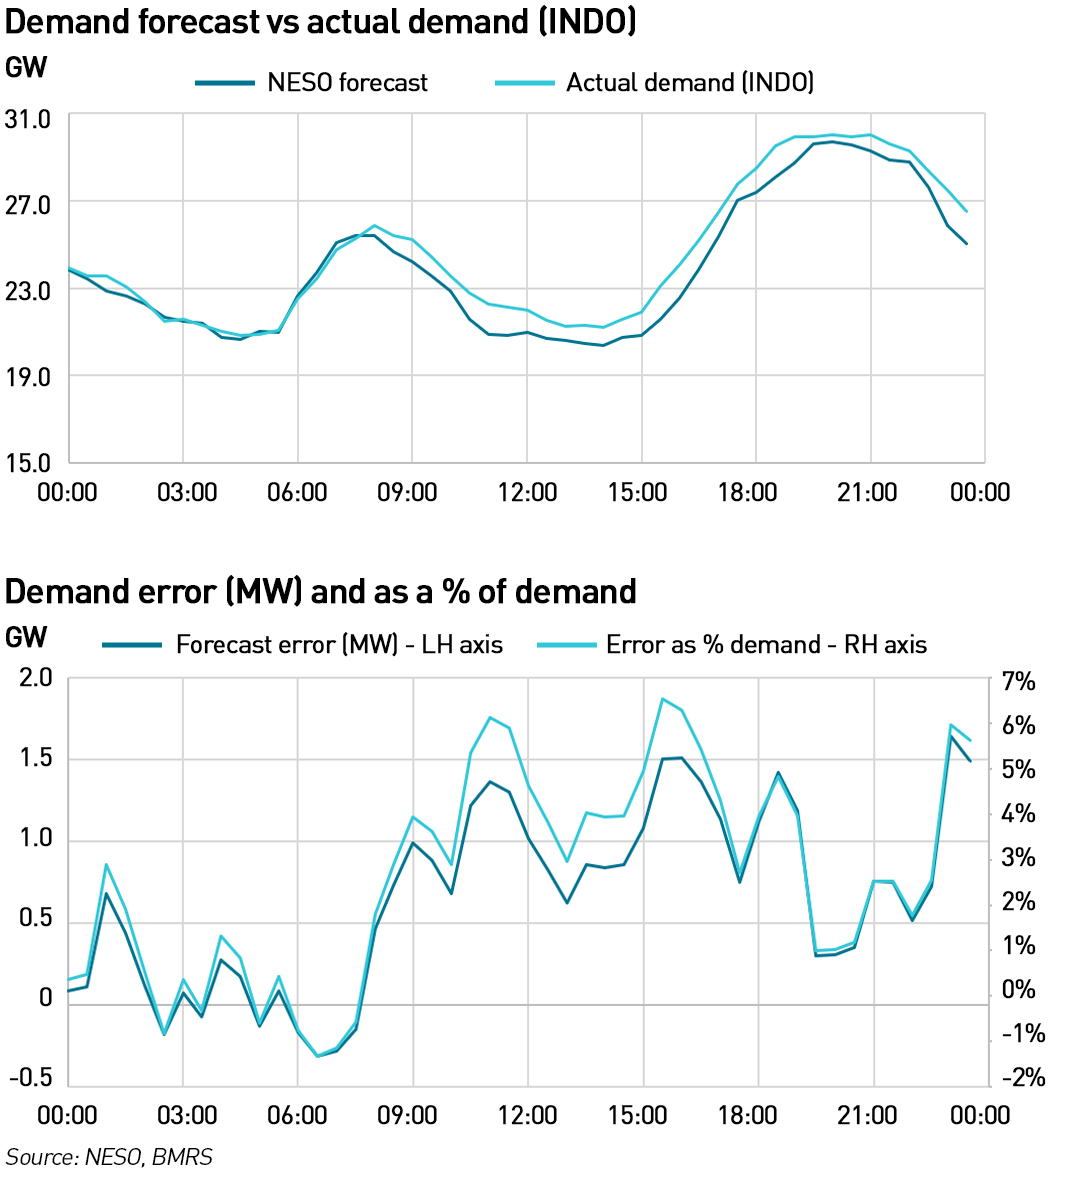
Although the error during the evening was smaller, these are average half hourly errors which could significantly under-state the moment-to-moment error. NESO balances the grid in real time, not simply across each half-hourly settlement period. These are also the Day-Ahead forecasts – NESO updates demand forecasts within day but does not publish these figures.
Stepping back, I took a look at the forecast errors since 1 April 2021 and 1 January 2026. The average error was 640 MW since 2021 and 800 MW this year, with the maximum error being 5.5 GW in each case. The maximum error as a percentage of demand was 27% in each case. The maximum error was on 29 March 2026, and the maximum percentage error occurred on 13 June 2026 which is why these figures are the same for each period.
In general, forecasting errors have increased over time, with average day-ahead forecast errors rising from around 600 MW in the early years of the dataset to 800 MW in the first half of 2026. This likely reflects the growing complexity of the electricity system as increasing volumes of embedded solar generation, battery storage, EV charging, demand-side flexibility and other inverter-based resources make net demand more difficult to predict accurately.
What tools does NESO have to support the grid?
NESO has a number of tools it can draw on – turning up generation in the Balancing Mechanism and buying additional imports via SO-SO trades (trades between system operators) being the main ones. Beyond that it can restrict exports using Emergency Assistance requests – these can be rejected by the connected country but ultimately NESO can simply turn off the flow at the outgoing substation without the consent of the other TSO – and after that the next step is demand control. The first levels of demand control are to lower voltage, and after that demand is disconnected.
Demand disconnection is more difficult when an EMN hasn’t been issued since typically under an EMN suppliers are asked to indicate expected demand at different grid supply points (points where the distribution networks connect to the transmission system). This enables NESO to evaluate which regions can be disconnected to protect the entire system – for example if the margin shortfall is projected at 3 GW, and suppliers indicate that expected demand is 4.0 GW in Scotland, 1.7 GW in Wales, 6.3 GW in Ireland, 4.5 GW in NW England, 3.2 GW in NE England, 2.1 GW in SW England, and 7.6 GW in SE England then the obvious step would be to disconnect NE England as this would restore a positive margin. Then if the shortage persists for longer than 4 hours, the emergency rules apply with rotating regional blackouts.
(This isn’t quite how it works – it’s more granular. DNOs will be instructed to turn off consumers from primary substations based on blocks (A = domestic, shops and offices, B = mixed residential, C = industrial /residential, D = residential). So disconnections are spread around the country rather than all happening in one region at the same time and will rotate around the blocks as necessary. But within each block connected to any substation, everyone is disconnected unless they have a dedicated feeder or are on an exempt circuit eg hospitals, airports, major telecoms sites, railway signalling and so on.)
Checking to see how much generation NESO instructed in the BM is a time-consuming task (as I’m still catching up on work I missed during my illness, I don’t have the time for that right now). However, I’m told by various industry sources that NESO had instructed all available generation and there was no spare slack in the system. I have submitted an FOI request to NESO to verify these claims and will update this blog with the response. If anyone else has the time to dig into the BM data for this period I’d be interested in the results.
NESO traded up to the 1,500 MW limit at the start of the evening, but did not request additional capacity. However it did curtail exports, initially by requesting Emergence Assistance on Britned to cut exports to the Netherlands, and then by making a similar request to cut exports on IFA to France as indicated in the chart above.
That the frequency continued to track below the safe operating limit despite these actions suggest that the system was not secure. I have also asked NESO in the FOI whether any thermal or stability grid constraints were violated, because it does not appear that any demand control actions were initiated.
The first steps in demand control are not to disconnect consumers, but to lower voltage. Most consumers don’t require exactly 230 V (the UK statutory supply voltage is 230 V +10%/-6% (216.2 – 253 V)) but in practice many customers receive around 240 – 245 V as a matter of course. This gives NESO room to reduce voltage while remaining within statutory limits. Lower voltage lowers demand but the impact depends on the equipment in use.
Power = (Voltage)2/Resistance
A 5% reduction in voltage will give roughly a 10% reduction in instantaneous power for resistive devices, but power may be needed for longer to compensate eg boiling a kettle will take longer at lower voltage. Constant power devices such as electronics and heat pumps will draw more current to compensate for a reduction in voltage, so the load remains broadly the same. With induction motors, some will run less hard so there is a load reduction while others will compensate by drawing more current.
NESO has historically assumed stage 1 demand control will cut demand by 3% and stage 2 will cut 6%. I have asked NESO to confirm whether these figures have been recently updated to reflect the increasing prevalence of constant power devices on the grid now compared with in the past.
NESO was eventually able to stabilise frequency by curtailing exports to the Netherlands and France. But the low frequency persisted for several hours on and off, so I’m curious to know if all of the grid constraints were met during this time. There are two broad types of network constraint that may have been relevant during the event: thermal constraints and stability constraints.
A thermal constraint arises where too much power is being pushed through a circuit, transformer or other item of equipment, creating a risk of overheating. In simple terms, even if there is generation available somewhere on the system, NESO may not be able to use it if doing so would overload part of the transmission network. This is why the location of generation matters: a MW in the wrong place can make a constraint worse rather than helping the system.
Stability constraints are not primarily about overheating equipment, but about whether the system would remain secure following a credible fault, such as the sudden loss of a generator, interconnector or transmission circuit. These constraints are designed to ensure the system can withstand faults without losing synchronism, suffering unacceptable voltage collapse, or splitting into islands.
If all available generation had already been instructed but frequency remained persistently low, it’s possible NESO was unable to instruct further generation without breaching thermal or stability limits. Another, more serious, possibility is that some constraints were already being exceeded and NESO chose to accept that risk rather than initiating demand control. I have submitted an FOI request asking NESO to confirm whether any thermal, voltage or stability constraints were breached during the incident, and if so why demand control was not used instead.
Is NESO failing to keep pace with an increasingly complex system?
The data indicate that NESO’s demand forecasts are getting less accurate with very large errors now evident – the average error this year so far is a huge 800 MW (57% of the SQSS) with the maximum error per the NESO version of INDO of 5.5 GW, just under 4 times the reserve NESO is required to hold in respect of the single largest infeed loss. I struggle to see how NESO can demonstrate it is operating the system securely on this basis and would encourage Ofgem to ask this question: can NESO evidence that it is operating the grid securely rather than simply being lucky that it hasn’t been caught out yet?
I get the feeling that in NESO’s view the absence of a blackout is “proof” the system is secure – this is not the case. Faulty wiring in your house are not “safe” simply because your house hasn’t burned down yet, nor is running out into traffic “safe” just because you don’t get run over every time you do it.
Over the course of a week we had two summer EMNs – never been seen before – and three instances of EU interconnector trading limits being breached. But most worrying is that the grid appears to have been unstable on 23 June and there were no warnings from NESO at all which suggests it simply didn’t see the problem coming. What’s also worrying is that NESO normalised export curtailment as a regular operational tool – after all, as no system warnings were issued, the 23 June was treated as a “normal” day, and so Emergence Assistance on interconnectors was added to the normal operational toolkit.
This came within a week of NESO publishing the Early Winter Outlook in which it confirmed a significant reliance on imports. Of course, export curtailment isn’t just something NESO can do – all the countries which export to us could do the same. And NESO just made cutting off previously agreed flows unexpectedly part of the normal operational toolkit, so perhaps we will see other system operators doing the same and restricting our access to imports even when their grids are not notionally under stress. This puts our winter system security at greater risk, undermining the winter margin NESO claims to have (of 5.5 GW, which is coincidentally the same as the maximum DA demand forecast error so far this year…).
I’d like to see an explanation from NESO about the events of 23 June:
- Why did the frequency keep falling below the safe operational limit?
- Why were exports to other countries abruptly cut without there being any systems warnings issued within GB, such as a High Risk of Demand Control notice?
- Why was cutting exports preferred to voltage reductions, particularly given GB’s high reliance on imports in the winter?
- Were any grid constraints violated?
However I’m not holding my breath – NESO’s attitude towards transparency leaves a lot to be desired. Nothing to see here…until there is.
Thanks Kathryn. I think NESO are also proposing widening the frequency tolerance band before they issue emergency notices? If so, I guess that must mean that they are confident that they have things under control?