
While Britain has been struggling with unprecedented retail market chaos, there have been unprecedented events of a different sort on the other side of the world in South Australia, which saw negative demand on the transmission system for the first time ever. In fact this was the first time any gigawatt-scale grid had experienced negative demand, anywhere in the world, and is a potential sign of things to come elsewhere as renewable penetration in distribution networks grows.
Negative transmission system demand seen for the first time on a large-scale electricity grid
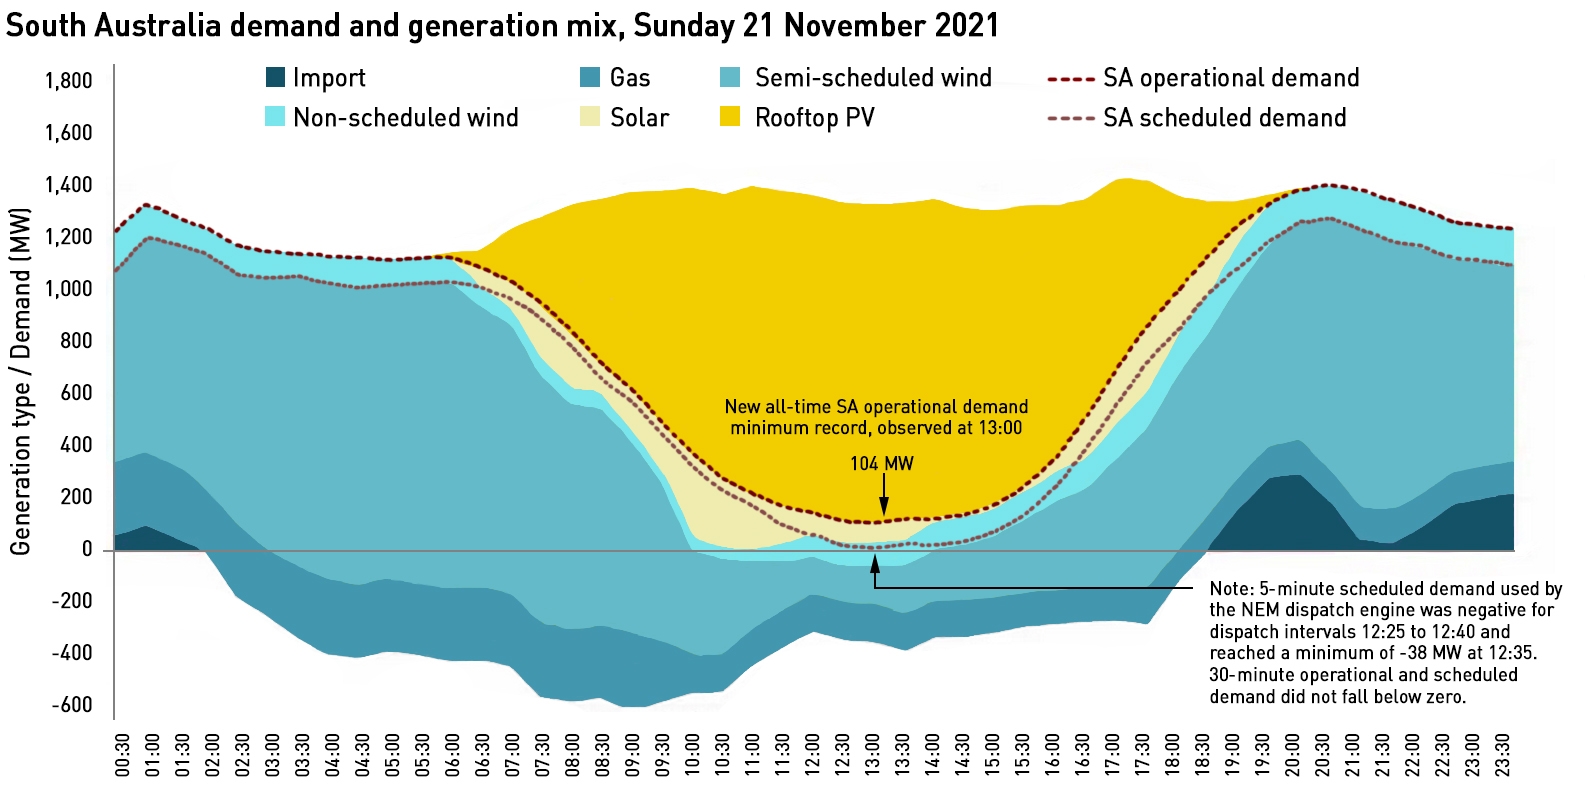
On Sunday 21 November the combined output of rooftop solar and other non-scheduled generation exceeded local customer load demands in the South Australia region. Minimum operational demand reached new record low of 104 MW, 45% lower than the previous record of 188 MW on 31 October. Between 13:00 – 13:30, estimated rooftop solar output was 1,220 MW, accounting for 92% of the region’s underlying demand, according to the Australian Energy Market Operator (“AEMO”).
At 13:05 AEMO was dispatching around 120 MW of gas to maintain system stability. In addition to this, a further 16 MW of gas, 130 MW of wind and 46 MW of transmission-connected solar generation in South Australia was bidding into the National Electricity Market (“NEM”). All of this electricity, and 38 MW of excess rooftop solar, was exported into Victoria via two interconnectors for consumption in the NEM, resulting in a scheduled demand of -38 MW and a total demand of -46 MW, when accounting for interconnector losses.
“South Australia had negative electricity demand on Sunday for several five-minute trading intervals, which is a first for the NEM. This happened because the combined volume of surplus rooftop solar PV and non-scheduled solar and wind generation was greater than electricity consumed in South Australia. The NEM performed as expected during this unique event, made possible by directing gas plants to maintain system strength and capacity available via the Victoria-South Australia interconnectors to spill the excess rooftop solar and dispatch the 350 MW of electricity sold into the NEM,”
– Michael Gatt, Executive General Manager Operations at AEMO
This followed several periods of negative demand beginning in late September in South Australia’s distribution networks, which occurred on five successive Sundays, and once, in late October, for more than four hours.
This graph shows that five-minute scheduled demand used by the NEM dispatch engine went negative for the three dispatch intervals from 1225 to 1240, reaching a minimum of -38M W at 12:35. Rooftop solar reached a record of 92.2% of total demand at 12.20 – the previous record share of demand was 88.3% on 31 October. The highest total amount of rooftop solar generation recorded was 1,301 MW on Thursday 4 November.
The state government has a target of net 100% renewables by 2030, but expects to reach this level well before then, particularly after a new interconnector to New South Wales opens in 2025.
Maintaining system stability is becoming a serious challenge for AEMO. In addition to running a certain amount of synchronous generation, synchronous condensers have recently been commissioned (as they have in the British market), and interconnectors to neighbouring grids are used to export surplus production. The new synchronous condensers allowed AEMO to increase the non-synchronous limit to 1,900 MW in South Australia from 10 September.
AEMO has also introduced a range of new measures to manage the growing share of rooftop solar, which is expected to double in size over the next 10 years. This includes a “solar switch-off” mechanism, which has been deployed once so far, and it is also exploring more sophisticated solutions such as creating load through the dynamic response of battery storage and appliances to utilise the excess solar output.
Power prices have also headed into negative territory
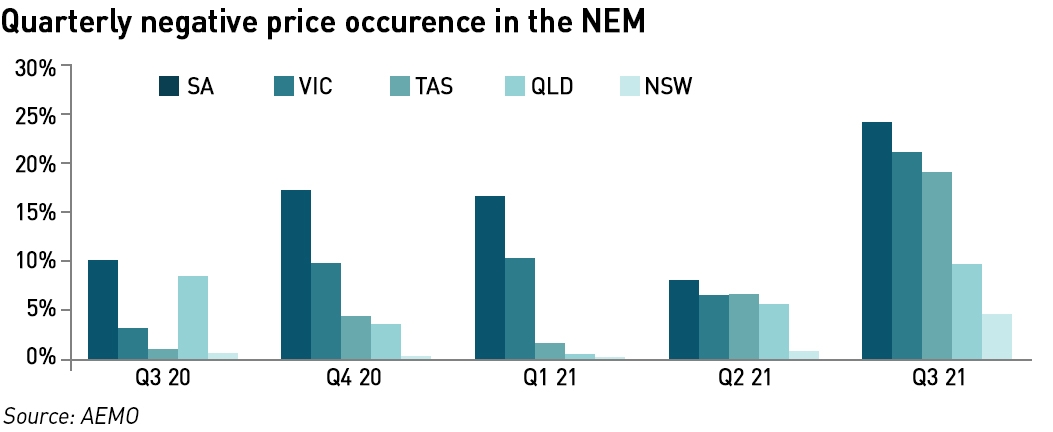
High levels of renewable generation with near zero marginal cost is depressing market prices, increasing the amount of negative pricing. In its most recent market assessment, the Quarterly Energy Dynamics report for Q3 2021, AEMO shows negative and zero prices across the NEM for 16% of the time – more than double the previous record of 7% in the last quarter of 2020. There were records in all regions including New South Wales, where negative spot prices occurred in 5% of all trading periods where previously negative prices had been rare. The number of negative price intervals were significantly higher across all regions, but particularly in South Australia which had negative spot prices for a quarter of the time, Victoria with 21% negative pricing and Tasmania with 19%.
Negative prices most frequently coincided with peak solar output in the middle of the day. Victoria saw an average price of just A$ 0.01 /MWh for 10:00 – 15:30 during August and September. Increased wind generation in South Australia from new capacity as well as windy weather contributed to negative pricing in the state, while increased rainfall in Tasmania boosted hydro production there.
Generators have responded to negative prices by increasing their re-bids in the market. Wind and solar generators are growing their deployment of automated bidding software which has seen the number of re-bids by NEM wind and solar farms rise by 4.5 times in Q3 this year compared with Q3 2020, as generators raised their offer prices to ensure they were not dispatched during periods of negative pricing. As a result, the average marginal price set by wind and solar across the mainland NEM moved from -A$ 51 /MWh in Q3 2020 to -A$ 1 /MWh in Q3 2021.
Thermal generators have also responded with brown coal plant shifting marginal capacity to higher price bands (A$ 10 /MWh to A$ 35 /MWh) during these periods. Average brown coal output fell by 332 MW between 10:00 and 16:00 compared with Q3 last year, coinciding with the periods when frequency of negative spot prices was greatest.
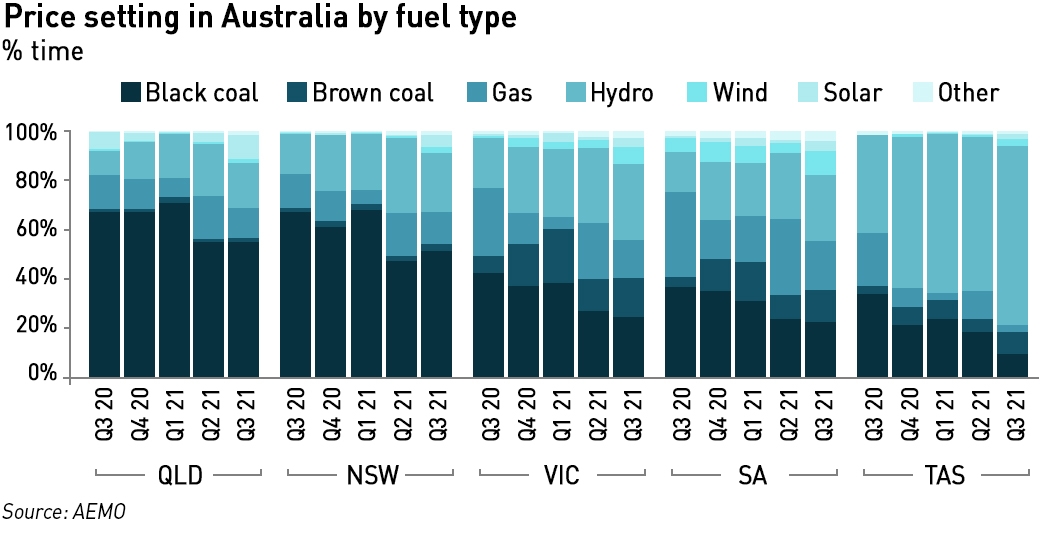
Gas plant set market prices in 13% of trading periods in the quarter, down from 20% of the time in Q2, while price-setting by variable renewable generation rose from 3% in Q2 to 9% in Q3. Black coal set the price slightly more often in the northern states than in southern regions, indicating a greater proportion of periods where prices diverged across the country.
Higher balancing costs and more renewables curtailment
In Q3 2021, the total NEM system costs of A$ 171 million were slightly higher (8%) than in Q2 and but were more than 3 times higher than in Q3 2020, with frequency control ancillary services (“FCAS”) being the main cost contributor. FCAS costs decreased slightly from Q2 2021 to A$ 130 million in Q3, but were A$ 95 million above Q3 2020 and represented 76% of quarterly system costs. Lower spot prices meant that more frequent dispatch of synchronous condensers and gas-fired generation was necessary in South Australia to maintain system strength, with the cost of these directions increasing by A$ 17 million compared to Q3 2020. The estimated costs of renewables curtailment increased by A$ 5 million from Q3 2020 due to greater curtailment impacts from system strength and network constraints.
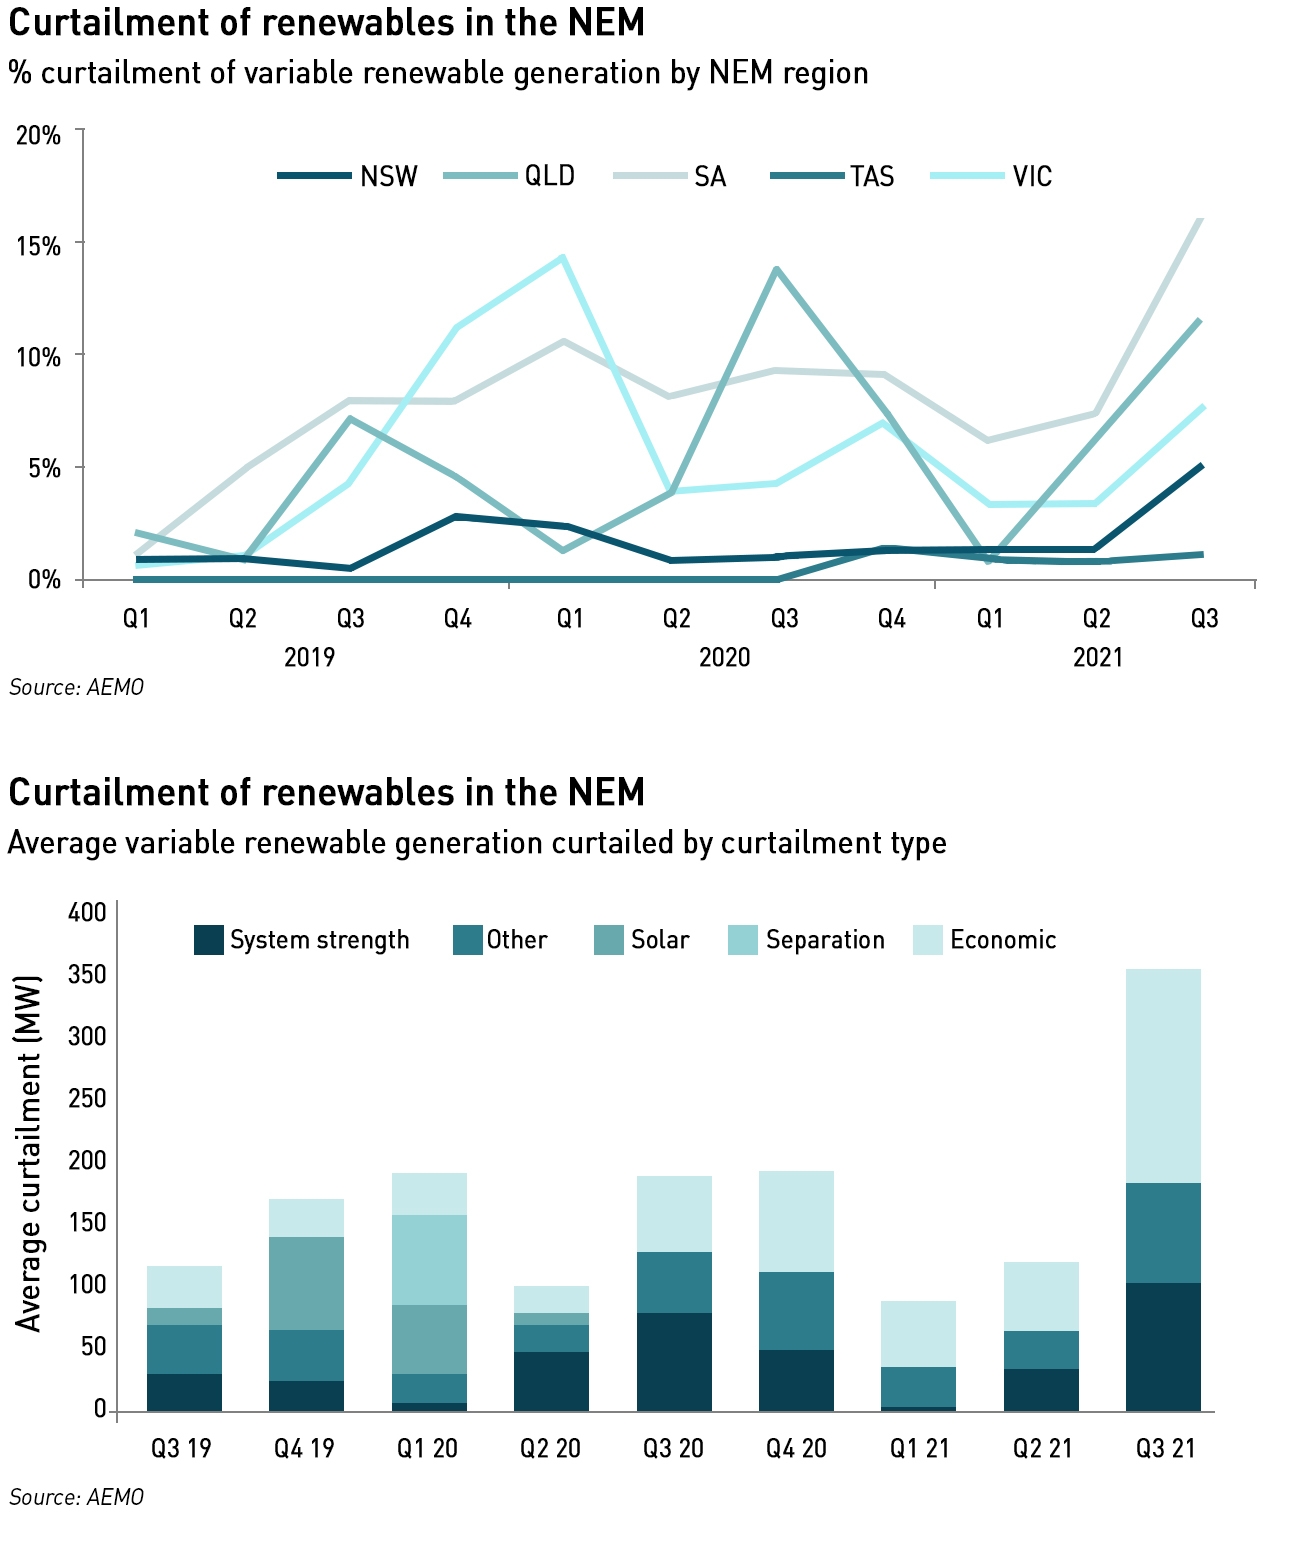
During Q3 2021, average renewables curtailment rose to a record high 351 MW, or 9% of potential semi-scheduled output, compared to 4% of potential output in Q2 this year and 6% in Q3 last year, with curtailment growing in all mainland NEM regions. In absolute terms more wind (205 MW) was curtailed than grid-connected solar (146 MW), but relative to potential output for each technology, solar curtailment at 14% was more than double that of wind at 7%.
Interestingly, on 21 November, South Australia produced nearly twice as much wind and solar as it could use at during certain settlement periods, forcing significant curtailments which at one point almost equalled total demand. Curtailment peaked at 1,307 MW at 13.55, representing a record 93.73% share of native demand in the state. Curtailment in Victoria also reached record levels with a maximum of 2,181 MW at 13.35. Across the NEM, curtailment peaked at 4,897 MW at 12:00 – 20.7% of demand – and totalled 39,875 MWh for the day.
Most of the curtailment was from wind, although all of the big three solar farms in South Australia were turned off at various times to avoid negative prices, which in many instances they are required to do as part of their contracts.
.
Unfortunately, in Australia, negative pricing and renewables curtailments are set to continue, and there may well be further periods of negative demand on both transmission and distribution networks. While negative wholesale prices should limit the construction of large-scale solar, rooftop solar still benefits from feed-in-tariffs and various features of network pricing which encourage more deployment despite the fact that the market is reaching saturation point. This also means that the environmental benefits of new solar are declining since it no longer displaces fossil-fuel generation to the same degree – instead it is increasingly displacing other forms of renewable generation. When the embedded emissions of solar and other renewable technology is considered, this becomes environmentally harmful as well as being an inefficient use of capital.
While this issue is becoming pressing in Australia, it is unlikely to be a major factor in northern European markets any time soon, since it is generally much less sunny – renewables curtailment in this region tends to be more a result of network constraints than excess capacity. But there is an important lesson to be learned around setting the right market incentives to ensure that the transition to net zero is managed cost-effectively with both natural and financial resources being used optimally.
Thanks , it was interesting. I don’t think we need to worry about the embedded carbon of renewable power and having too much renewable power. If the power is there someone will find a use for it and that use will displace ‘carbon emissions’ somewhere else down the line.
Except that renewable generation is displacing other renewable generation which is being curtailed, so the excess is not being used. This means the embodied emissions are not displacing any operational emissions elsewhere and absolutely should be considered when setting incentives in the market.
Once again an interesting post. I know very little about Australian weather but I suspect that it is dark at night in South Australia. As they have far more solar than wind I suspect that days are mostly sunny and calm. How then do they propose to meet their (admittedly vague – are they talking minute to minute or the delusional concept of annual ‘equivalent’ energy ) 100% renewables target at night.
A sign of things to come in the UK if we ignore all this and the wrong road is taken. Our days are mostly windy and dull. Solar over generation will unfortunately never be a problem but on windy weekend nights we are already there. This feast and famine of electricity production is not an optimum use of resources nor will it lead to net zero. In fact it guarantees a reduced but still very significant market for fossil fuels in electricity production. It also results in huge generation overcapacity with resulting under utilisation of flexible plant and curtailment of renewables.
To set some successful market incentives we must first carry out some ( at least basic) modelling work to determine how various future generation mixes interact with possible demand patterns. If this is done some group think preconceptions may be shattered.
From what I understand of the SA market, coal plant is required to ramp up very rapidly at dusk to off-set falling solar output. Battery storage helps to support these shoulder hours, but we can see that even though SA is much sunnier than here, there is still significant seasonality.
Here in the UK, there are people looking at over-building solar so they can meet their annual demand through owned renewable generation. The problem is that they over-produce in summer and contribute very little in winter. In the absence of seasonal storage, if everyone did this the market would be saturated in summer with negative prices and renewable power being significantly curtailed, while there would be little benefit in winter. As you say, feast and famine is inefficient.
Battery storage is truly insignificant as a supply source after dark. Just look at the NEM chart I posted in my main comment. Or see how the Horndale Power Reserve is really used. Here’s its operation alongsidevthe economics wind farm and the scale of curtailment in South Australia on 21st November.
http://nemlog.com.au/show/unitprice/20211121/?k1=HDW,HPR&k2=sa&id11=CURTAILMENT.DISPATCHREGIONSUM1&k11=sa
It was probably much more concerned to pick up FCAS revenue.
economics = eponymous
These charts also offer some insight that suggest thatbin South Australia it’s windier at night than during the day, and that wind tends to get curtailed along with utility solar in the middle of the day to accommodate the rooftop solar.
http://nemlog.com.au/nlog/regional-re-share-and-price-profiles/
Fascinating analysis. It’s been a while since I have looked at Australia in much depth, although I did have a brief look at South Australia for the week 14th-20th November which showed extensive periods of negative prices caused by excess renewables and export and inertia constraints, with exports and rooftop solar having a negative value and utility solar curtailing. Also periods of low wind and dependence on imports and fossil fuels. Chart of the action
https://uploads.disquscdn.com/images/3c89b742f798ab6c3df3d2e3b16497e29331ef277ac6f31ab79c88c230b89efa.png
I commented “the chart of the last 7 days from South Australia you will see that utility scale solar does indeed curtail to avoid supplying at negative prices, but rooftop solar is not paid on the basis of Regional Reference Prices, so it does not curtail, and neither does wind, which receives a guaranteed subsidy of at least A$85/MWh and grid priority. The result is exports to Victoria at negative prices, at least until the export capacity is reached, at which point further curtailment becomes the only option, especially since there has to be a minimum of inertia providing generation under AEMO rules to try to prevent the grid from having too high a risk of collapse.”
I also found that NEMLOG is now doing charts on curtailment with a degree of drill down and data download
http://nemlog.com.au/nlog/nem-and-regional-curtailment/7d/
All sorts of other specialised analyses from here http://nemlog.com.au/nlog/ which you can learn to tailor through url edits.
I wish that reporting were as thorough and prompt in the UK. The UK will face problems when it has 50GW of wind in 2030 (40GW offshore). We will then have frequent surpluses. Trying to use it for storage/hydrogen is going to be economically challenging.
https://datawrapper.dwcdn.net/nZM72/1/
More curtailment or zero revenue donations to storage just forces up the price that must be paid for useable output if the wind farms aren’t to go bankrupt.