
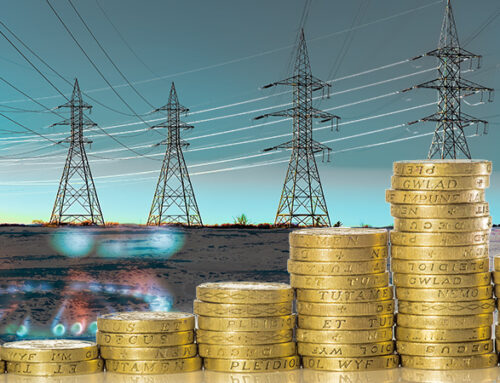
Last week, National Grid ESO published the first costings for its Future Energy Scenarios (“FES”). The key conclusions of its analysis are:
- The cost difference between the four scenarios is just 7%
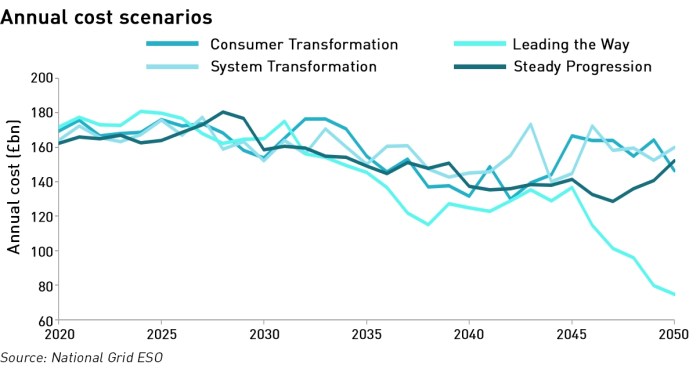
- The total cost of each scenario over the next 30 years is around £3 trillion
- The annual cost of the scenarios varies from £162-£172 billion in 2020 to £75-£140 billion in 2050

The first thing to keep in mind is that none of the scenarios represent the “base case” – no change from today other than those already baked in such as the closure of the remaining coal plant, and the retirement of aging nuclear reactors.
National Grid’s FES cost assumptions and their application
Power Generation
- Costs of wind forecast to fall with offshore wind capex costs projected to fall by 47% between 2020 and 2050 and opex costs by 25%;
- Waste CHP is by far the most expensive form of generation from a capex perspective;
- Most technologies have flat capex and opex costs out to 2050;
- Biomass with CCS only appears after 2026 and gas with CCS after 2030.
Research by Professor Gordon Hughes from the University of Edinburgh challenges the commonly-held assumption that offshore wind costs are falling. He has examined the audited accounts of the project companies (most UK windfarms are separately incorporated and are required to file audited accounts with Companies House which means that the capex and opex costs at the project level can be inspected directly). While his results are controversial it is difficult to argue against the clear indications that despite public statements by project developers, and the Government’s projections, the capex and opex costs of windfarms are not falling.
At the same time, the capex and opex costs of most other technologies are flat across the period implying that there will be little or no cost improvements in those technologies. Even new technologies such as biomass and gas with CCS show smaller annual cost reductions once they enter the market that is the case for the relatively more developed wind technologies. This is illogical…if wind costs fall compared with thermal generation costs there could be an argument that there is limited scope for “learning” benefits in mature technologies, but by this same argument, technologies that currently do not exist ought to see sharper “learning” benefits than the relatively more mature wind technologies.
This disconnect introduces a significant bias into the economics of power generation across all the scenarios. If Professor Gordon’s analysis is correct (as is likely, being based on audited accounts), and if the costs of wind fail to fall or even increase, the assumptions on the cost of wind power both in absolute terms, and relative to other sources will be undermined. This is important since wind is the biggest cost contributor to electricity generation in every scenario.
Consumer Transformation has the highest undiscounted cost of electricity generation of £644 billion. System Transformation has the next highest costs at £576 billion, followed by Steady Progression with £564 billion and Leading the Way with £594 billion (for some reason the row marked “total” in the workbook does not correspond to the sum of the costs listed, so I have used the sum of the costs as they correspond with the chart published in the report).
The scenarios include carbon costs and credits, where the credits relate to assumed negative emissions from biomass with CCS. This relies on a number of assumptions: that biomass with CCS will emerge as a significant, viable technology and that the carbon prices evolve as assumed (see below).
Removing these carbon costs and credits, Consumer Transformation and System Transformation are still the most expensive scenarios with generation costs of £690 billion and £628 billion respectively, but now Steady Progression is by far the lowest cost scenario with generation costs of £517 billion compared with £619 billion for Leading the Way.
Residential Heat
- Gas boilers and hydrogen boilers have equivalent costs that are flat out to 2050;
- Capex costs for all heating technologies are flat apart from hydrogen micro CHPs which see a significant year-on-year drop until 2030 after which costs are flat and solid fuel which falls to 2045 after which it is flat;
- Opex costs across all technologies are similarly flat other than hydrogen micro CHPs whose opex follows the same path as its capital costs;
- National Grid assumes flat annual household expenditure on insulation in each scenario with Consumer Transformation and Leading the Way seeing £83.4 /kWh per year, System Transformation at £64.8 /kWh per year, and Steady Progression between the two at £73.2 /kWh per year.
It seems improbable that household spend per kWh on insulation will be flat out to 2050. Households might be expected to install more new insulation in the 2020s and 2030s as in the net-zero scenarios, households will need to make significant changes to the way in which they heat their homes, and retro-fitting insulation would make sense as part of the work.
By the 2040s, most properties should have been upgraded, with possibly the most difficult (and therefore higher cost) properties remaining. In all households, the cheaper projects are likely to be undertaken first, so later expenditure could be assumed to be more expensive on a £ /kWh basis as more challenging projects are likely to cost more. The idea that these factors all net off to give a flat profile does not seem likely. Nor is it credible to assume that the capex and opex costs of heating technologies will remain flat.
When the assumptions are applied to the scenarios, we see that the cumulative spend on domestic insulation is £313 billion in the Consumer Transformation and Leading the Way Scenarios, £162 billion in System Transformation and £92 billion in Steady Progression. Then we have the costs of the heating itself. The lowest cost of heating is in the Steady Progression scenario which sees a move to hydrogen. The next cheapest is Steady Progression, presumably driven by the assumption (see below) that gas prices will rise throughout the period.
Heating costs in Leading the Way are £542 billion and in Consumer Progression, £569 billion. This means that despite incurring the highest costs on insulation, these two scenarios also have the highest costs of heating. This is rather contradictory and one has to question whether consumers would be willing to accept a situation where heating is so expensive that even when large amounts are spent on insulation, the heating methods chosen are more expensive than the alternatives.
Road Transport
- Capex costs for petrol/diesel cars increase from £26,132 in 2020 to £27,857 in 2050; the capex costs of all other types of cars will fall over the period, by 6% for hybrid cars, 33% for EVs and a massive 55% for hydrogen cars. Electric, hydrogen and hybrid cars cost similar amounts and are approximately 55% of the cost of petrol/diesel cars;
- Hydrogen and electric bus capex costs fall significantly over the period but remain much more expensive than diesel and natural gas buses whose capex costs remain broadly flat;
- HGV capex costs see a reversal with natural gas and diesel HGVs starting out cheaper than their hydrogen and electric equivalents, but becoming more expensive after the late 2020s;
- Opex costs for cars all remain flat, but are approximately twice as much for petrol/diesel cars as for the rest. Opex costs for all other vehicle types are equal within each category (buses, HGVs etc) and flat out to 2050.
Electric cars appear twice in the spreadsheet with different capex cost amounts. There is no explanation for the two entries.
It is difficult to accept the dramatic reductions in capex costs for EVs and hydrogen cars, not least because in the case of EVs, there is a high reliance on scarce minerals, so a growing scarcity premium could be assumed. The ban on the sale of new petrol/diesel cars from 2030 does not seem to be reflected in the analysis, although a second hand market can be assumed to continue after this date.
The price points being used are also questionable – there is a very wide distribution of costs for new petrol/diesel cars reflecting different sizes and specifications – a brand new petrol car can be bought for as little as £8,000, a fraction of the £26,000 in the FES costings. The cheapest EVs currently available cost twice as much at £16,000.
National Grid also models Variable Operating Costs for each vehicle and fuel type, which presumably includes things like charging costs for EVs and road taxes. A breakdown of these costs is not provided, so it is difficult to challenge the assumptions, however, the idea that these costs are flat across all classes of vehicles and all years other than petrol/diesel cars is rather questionable. As are the amounts assigned. For example, the 5p /mile charge for EVs would be reasonable for charging at a private facility, but public charging costs can be double that.
When looking at the FES, we see that National Grid assumes there will be a massive reduction in the energy used for road transport in the future across all scenarios. There is no information on total numbers of miles travelled, but it is reasonable to assume that the size of this demand reduction could not be achieved without a significant reduction in mobility (ie energy efficiency could not account for the entire, or even majority of the reduction).

The looking at the road transport costs, we see that cars account for between 51% and 55% of costs across the scenarios. Leading the Way has the lowest transport costs at £2,118 billion, followed by Consumer Transformation with £2,436 billion, System Transformation with £2,556 billion and Steady Progression with £2,597 billion.
It can be assumed that the higher opex costs for petrol/diesel cars are a major factor in the higher costs under the Steady Progression scenario. This is probably driven by an expectation of higher road taxing for petrol/diesel cars versus other types of cars, and this is a key policy lever available to incentivise motorists to switch to “greener” cars.
However, the various motoring taxes bring in significant revenues for the Treasury, so it would be optimistic to assume that a large tax differential would persist for the entire period – once EV or hydrogen car penetration grows it is likely that they will see taxes rise in order for the Treasury to recover the revenue it currently loses from the tax beaks these vehicles currently enjoy. Indeed, road-related taxation pre-dates environmental concerns and have only recently been used to promote climate objectives.
Fuel and import costs
- The cost of importing hydrogen is assumed to be flat throughout the period, while the cost of electricity imports rises from £29.6 /MWh to £49.8 /MWh;
- The cost of biofuels is assumed to double out to 2050, while the costs gas for heating rise by 38%. The costs of oil increase sharply to 2025 and slowly decline thereafter while the costs of LPG and solid fuels remain constant.
The cost of gas rises from 43 p/th in 2020 to 70 p/th in 2050. As the charts below show, NBP prices have oscillated between 25 p/th and 75 p/th over an extended period. National Grid’s price forecasts are higher than many of the broker or consultant forecasts (they were the highest of the ones I was able to find, although not all consultants make their forecasts public). Interestingly, the BEIS forecasts are higher.
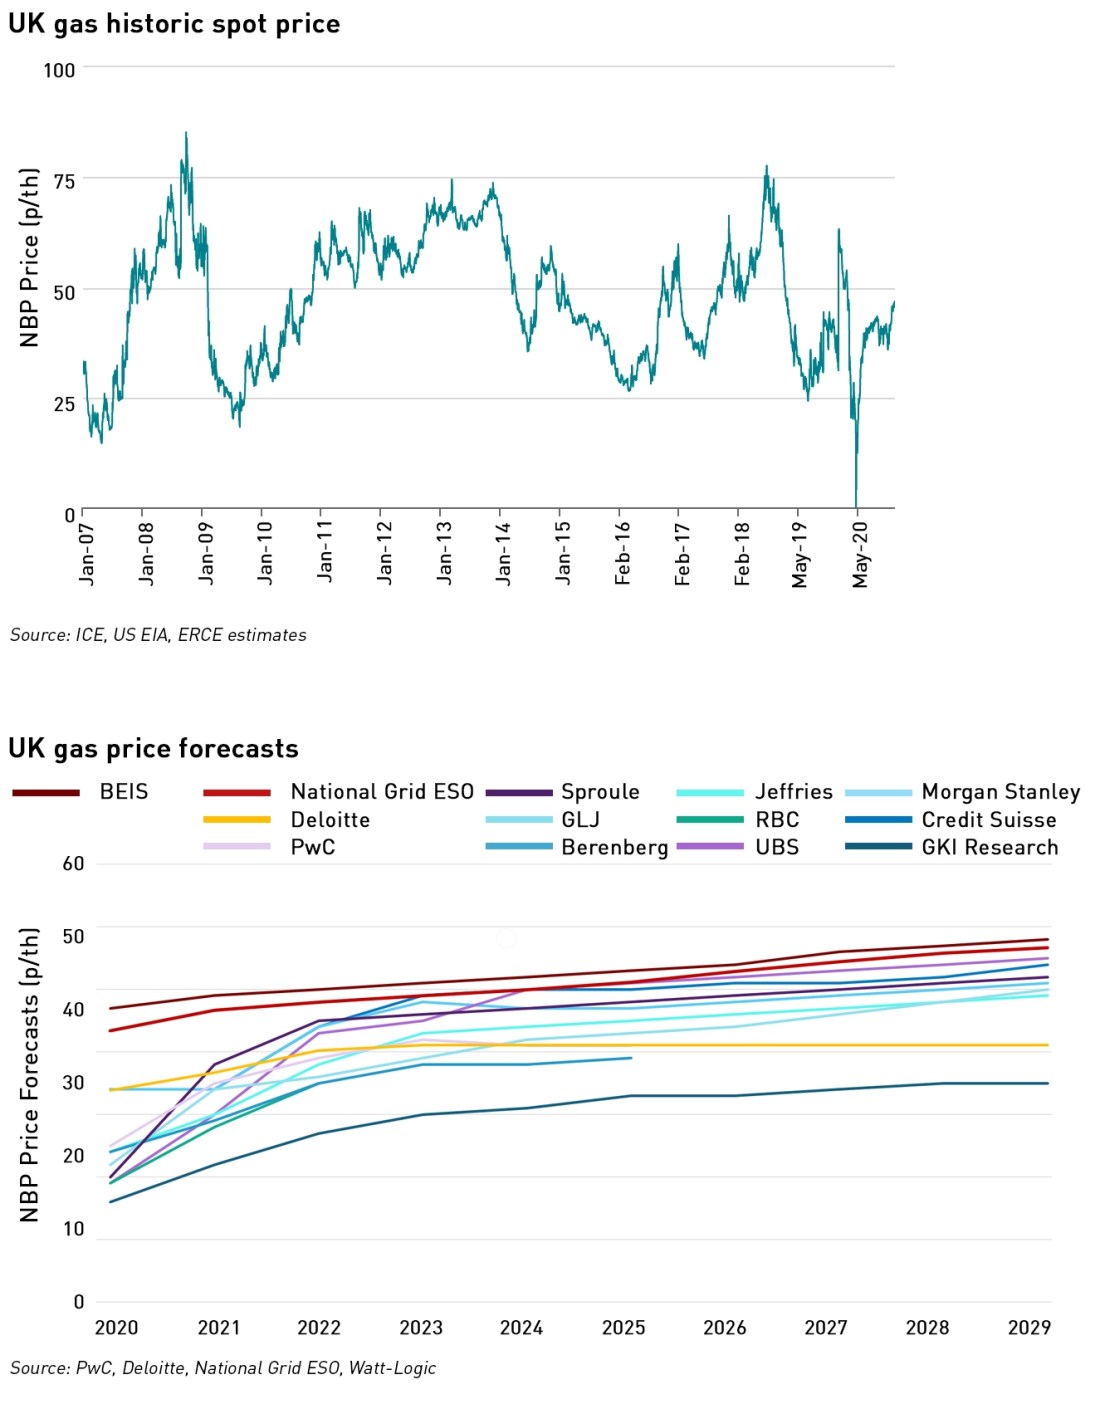
The National Grid price forecasts (and the BEIS forecasts for that matter) sit at the top of the market expectations for gas prices. This does not seem sensible, and they should be adjusted to sit more in the middle of market projections to avoid biasing the heating and electricity generation scenario costings.
Carbon Cost
- All scenarios include a “carbon cost”, which rises from £39 or £47/MtCO2 in 2020, to £79 – £225 /tMCO2 in 2050;
- Carbon credits are applied to the electricity costs in the net-zero scenarios on the basis that there will be negative emissions from biomass with CCS. These credits are £46 billion in Consumer Transformation, £51 billion in System Transformation, and £124 billion in Leading the Way. There is a £47 billion carbon cost in the Steady Progression scenario.
These numbers are highly speculative, as is the assumption that biomass with CCS will be deployed and will achieve the levels of negative emissions predicted. It is difficult to justify the £8 /MTCO2 difference in 2020 between the scenarios, and the future carbon prices show very significant increases from today in the net-zero scenarios which could be politically difficult to introduce – the carbon price floor was introduced in 2013 at a rate of £16 /tCO2e and was set to increase to £30 /tCO2e by 2020, but in fact it has been held at £18 /tCO2e since 2018 and is capped until 2021 (although the UK’s entire approach is being reviewed in the context of Brexit).
Even in the Steady Progression scenario the carbon price is assumed to more than double over the next 30 years.
Networks
- Energy networks are assumed to be unconstrained.
Assuming unconstrained networks is a significant assumption. Currently, there are network constraints that limit the transmission of renewable electricity generated in Scotland to the main demand centres in the south of England. Assuming an absence of network constraints assumes all electricity produced can be delivered to users at all times. This ignores the network investments that will be needed to make this actually the case.
Finally, it is also worth noting that appliance capex costs are excluded, ie the cost to consumers of purchasing new fridges and washing machines despite the fact that smart appliances feature heavily in the net-zero scenarios, with 83% of households having smart appliances in the Leading the Way scenario. This seems quite a significant cost to omit from the analysis.
What can we tell from the FES cost presentation?
The two most striking aspects of the National Grid FES cost analysis are firstly the magnitude of the costs involved: even in the Steady Progression scenario where net-zero ambitions are not achieved, energy costs approach £3 trillion to 2050. Secondly, the cost difference between the scenarios is just 7%.
“Even though this is not a total cost of Net Zero, it is evident from our analysis that the scenarios that deliver Net Zero do not result in a material increase in costs over the scenario where Net Zero is not met by 2050,”
– Rob Gibson, National Grid ESO
This second fact seems highly unlikely, and it would be helpful here if National Grid included the costs of a “No Change” scenario, projecting a continuation of today’s market, with relatively minor adjustments to account for the coal exit and retirement of the nuclear fleet, with an assumption that there are no changes to heating and no move away from fossil fuels in transport.
Another consequence of this small differential between the scenarios is that the choice of pathway makes little difference, so for example, whether there is a big move towards hydrogen makes little overall difference.

Unpicking the impact of any questionable assumptions, and examining the affect of changes to the assumptions is almost impossible, since National Grid has not published its model with formulae – every cell contains hard numbers, so the entire model would need to be reverse engineered to examine this in more detail. If any reader has the time to do this, I would be very interested in the conclusions, and would be happy to input new cost assumptions for consideration.
One thing I did look at was the impact of some of the carbon cost. As noted above, the net-zero scenarios show carbon credits in the cost of power generation based on the assumption that biomass with CCS will result in negative emissions.

Just this one adjustment removes to cost advantage of the Leading the Way Scenario over Steady Progression.
The idea that the most aggressive de-carbonisation scenario has the lowest overall cost would seem to be wishful thinking, and even this one adjustment to the assumptions has an immediate impact. I would ideally like to run sensitivity analyses on all of the assumptions to test their impact when each parameter is flexed within a reasonable range.
Net zero is going to cost a lot – this analysis obscures the impact on consumers and taxpayers
The biggest weakness of the FES cost analysis is that there is no attempt to analyse the impact on consumer bills. Since the FES workbook typically only provides a snapshot of the 2050 position and not the year on year change, it is impossible to reverse engineer today’s costs from the scenarios and either create a “No Change” scenario or assess how bills would change from today under each of the scenarios. A cynic might be tempted to believe this is because the cost differences are so high as to be unpalatable to consumers.
In order for any net-zero strategy to work, there will need to be public acceptance of both the need for change and the cost of that change. Currently there is strong public support for net-zero ambitions, but this support is largely based on ignorance of the costs at the individual level. At the same time, two things are true: consumers believe that energy costs are already high and there is limited appetite to pay more for energy, and secondly, few people are genuinely willing to make financial sacrifices today in order to secure a future benefit (as evidenced by studies showing under-investment in retirement savings and pensions).
Policymakers face a choice: be transparent about the costs of net-zero and the levels of personal sacrifice that will be involved, and risk public resistance, or continue to obfuscate, and risk a sudden withdrawal of public acceptance at a point where the energy system has undergone a partial transition and significant amounts of additional investment are needed to maintain lasting security of supply.
If the public is deceived about the costs and sacrifices needed for net zero, then there is likely to be significant opposition once this eventually becomes clear, as it inevitably will. If achieving net-zero by 2050 is genuinely “the right” thing to do, hiding the requirements would be unethical as well as politically risky – the arguments should be made openly and the public, from whom the sacrifices will be required, given an informed choice about how far it is willing to go.

I do feel that their idea of uptake of EVs is optimistic – give that the second market for such In that their price and battery replacement needs(AND costs ) is unknown; and is seems likely to be costly – which will mean that many cannot afford them (and especially in rural areas). Thus there will be limits on the uptake of Evs (and maybe scrappage of old ones whose batteries are defunct.. perhaps?
I saw an article by Roisin Quinn (of NG ESO) which purports that consumers will take up their part (by taking power when there is negative pricing) .Unfortunately the article does not say how much power was being used by the control group (o size 50000) – nor the percentage of EV ownership of the groups. It addresses battery storage as being at a power of 700 MW – but not their storage capacity (MWhr). Nor how many EVs will be required to contribute 40G of “capacity”
(see https://www.wired.co.uk/article/clean-energy-payment )
I am not sure if the lack of detail for there trial of changing customers habits is deliberate – but it certainly hinders the transparency of their predictions and trust in such.
First off thanks for such a great website!
May I offer some points of consideration
EVs can be significant net savings because of the following
Oil costs $63 a barrel today but that is the crude no one can use, the process of refining and delivering increases the price to about $100 a barrel in a petrol station. The UK can reduce its 1.6 mbpd oil consumption to around 0.7 mbpd if it electrified all land transport (cars vans HGVs Trucks buses etc)
The saving would be approximately 900,000 barrels per day x $100 after refining / 1.4 dollars per £ = £64 million per day
To displace this 900,000 barrels per day would require approximately 330GWh of electricity which would cost just ~£26 million per day (using an average 8p/KWh rate as most the charging will be done outside of peak hours)
The difference from £64 million to £26 million is a daily saving of £38 million or nearly £14 billion a year!!
As for the cost of EVs this is easy to solve. A ban on petrol/diesel vehicles solves this problem because currently almost no one would buy a cheap 100 mile range EV as a Ford Fiesta (best selling model in the UK) can be had for £14,000 with 500 mile range. With only electric as an option the market will offer for all price points including cheap 80-120 mile range EVs. Will customers be happy with 100 mile range EVs? Yes for 95% of days and the other 5% of days they will have to make do with a few supercharger stops
There is also a simple way to make low range EVs much more compelling
Offer totally free public slow charging with slow 7.2KW chargers literally everywhere on every street every car park in the country at least 5 million such free chargers everywhere and more if necessary. These totally free chargers would be cheap to install as no app no complicated card reader or payments just the simple home type chargers plug in and charge these would cost less probably around £1,200 per unit to install so 5 million units would be a £6 billion investment but if they last 30 years that is £200 million a year sounds a lot but divided by 35 million cars is just £5.70 per car per year in capital cost
And regulate the power companies to offer 1 hour of free electricity at night for all homes. 7.2KW x 1h x 365 days x 4 miles per unit = upto 10,500 miles per year free home charging. Probably the average car will use 1,600 units at home charging which will cost the utilities £80 a year and 400 units in public which would cost another ~£40. The government can pay the utilities £80 per home per year to offer this free charging. And this home £80 plus the £40 public charging can be recovered with a £150 a year EV tax
Having this huge quantity of 7.2KW public chargers effectively doubles the range of an EV
A 100 mile range EV can drive 80 miles to work plug in a 7.2KW charger and be full again in 3h times ready for the tip back home
Overall the switch from oil to electricity for road transport will be a >£10 billion annual saving
Would be glad to hear your views on this
Thanks
Have you taken into account the fact that greatly-increased power would be needed for domestic and commercial heating and hot water, necessitating the existing grid being upgraded to cope with the increased power demand?