
Yesterday demonstrated some of the challenges of high wind generation on the GB system, with lots of activity in the Balancing Mechanism, particularly to curtail wind and CCGTs, as well as bringing up CCGTs, and some counter-intuitive interconnector activity. It also exposed issues with poor forecasting, which I have highlighted before.
Wind output was forecast to be above 14 GW for much of the day. This pushed GB power prices down, incentivising exports, however, due to grid constraints, it was impossible to deliver on these exports using wind. This resulted in significant swings on the interconnectors, significant curtailment of wind generation (up to 3 GW) and localised dispatch of CCGTs in the Balancing Mechanism (“BM”) to provide both inertia and generation to meet the export needs.
In effect, because the market does not have a means of pricing in the impact of grid constrains, some gas power stations had to run in order to export electricity to the Continent after high wind expectations depressed wholesale power prices.
While some with argue that this means we should move to locational pricing, the reality is that under a locational pricing model, wind would run even less and gas mode because suppliers with generation in the south-east where demand is most highly concentrated, will seek to procure electricity from the interconnectors and more proximate CCGTs than from Scottish windfarms whose deliverability is uncertain due to lack of transmission capacity.
Due to the difficulty in gathering the data, I am only looking at the first half of the day, up to 1:30pm. The main data used are: Generation by Fuel Type and Bid Offer Acceptances from BMRS and the wind output and curtailment data from Amira Technologies PowerPlus platform (paid subscription). I used ChatGPT to clean the data and carry out some of the analysis.
Problems with forecasting
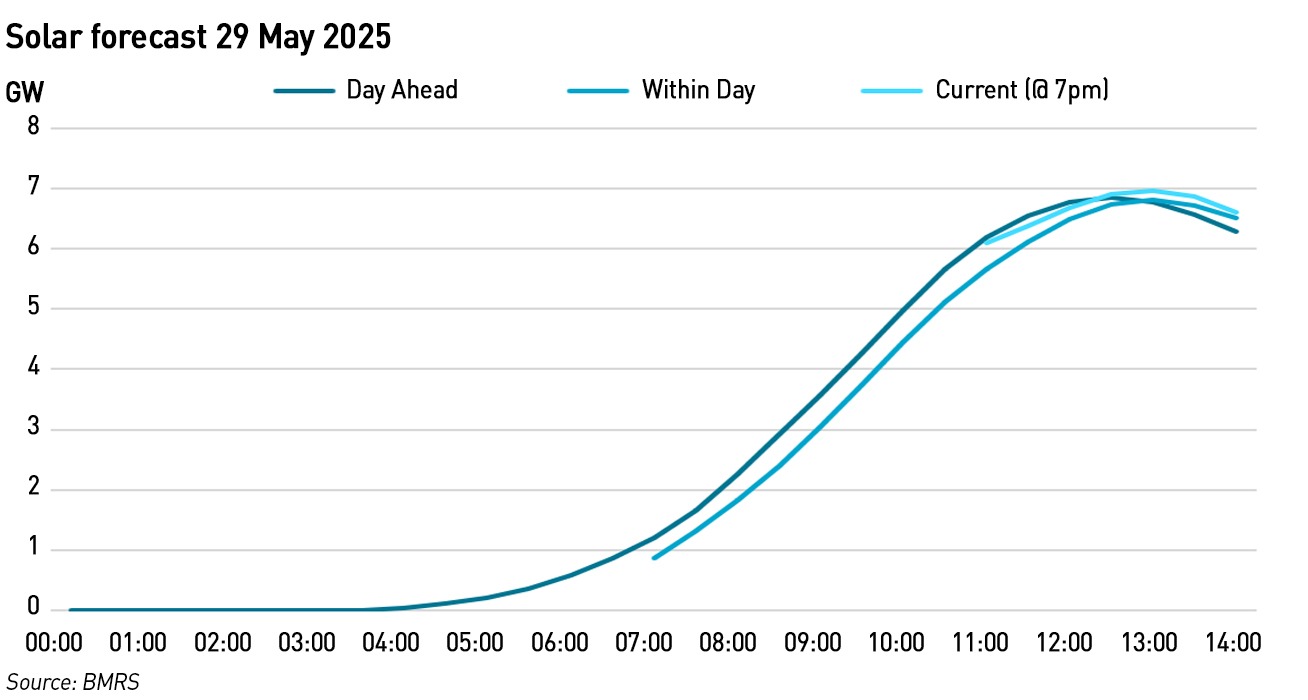
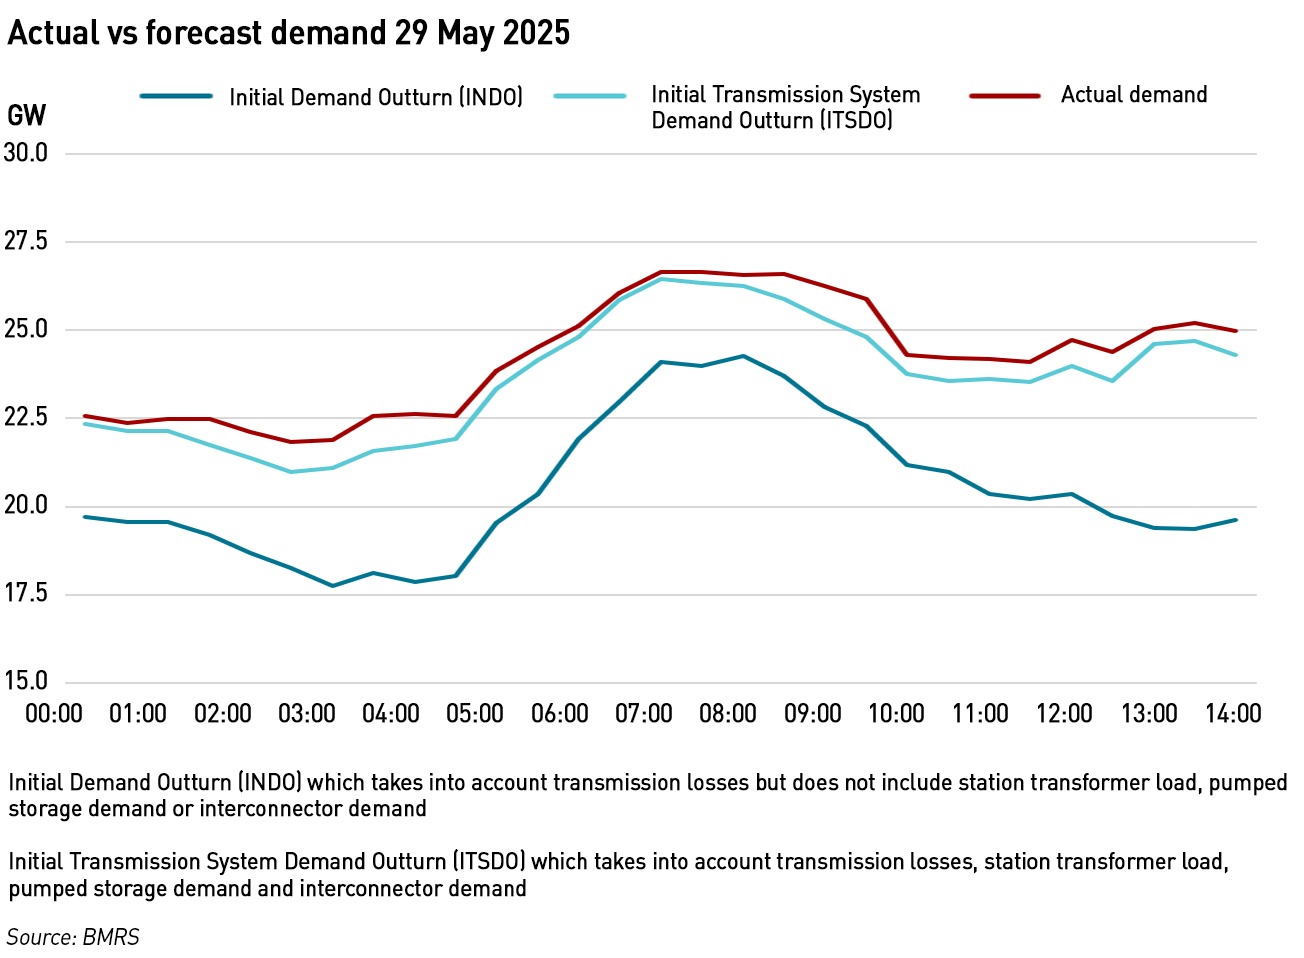
First of all we have the wind and solar forecasts. As the sun rose and demand ramped to its daily peak (peak transmission system demand in the summer is in the morning as distribution-connected solar depresses the evening demand peak), it was clear that the day ahead wind forecasts were significantly off. Over the morning peak there as a 3 GW difference between the day-ahead and within-day wind forecasts. There was an even bigger difference between the within-day wind forecast which was higher than the day-ahead forecast, and the actual wind generation (before curtailment) going through the morning peak – up to a huge 4.5 GW (28% of actual wind output and 17% of actual demand).
Just after the morning peak there was a 1 GW difference between actual and forecast demand.
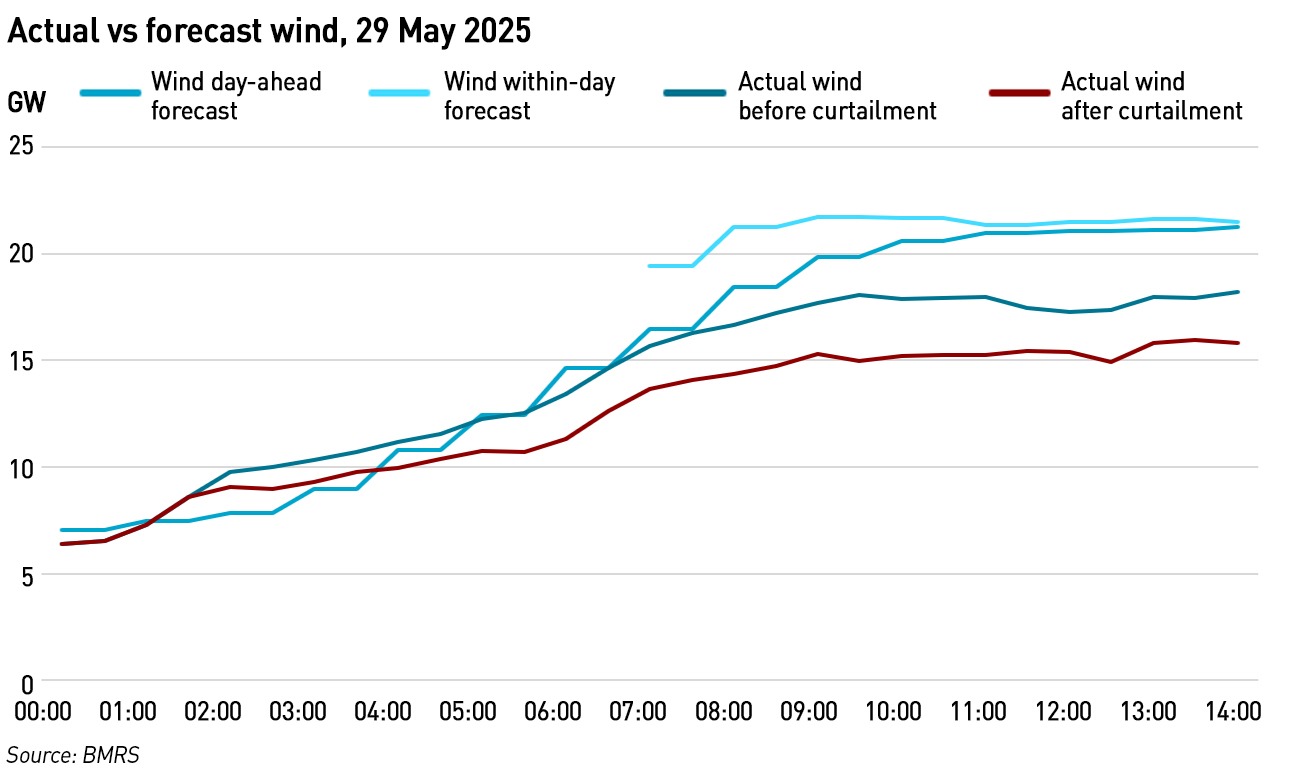
Actual wind output (before curtailment) fell well below both day-ahead and within-day forecasts, with a forecast error of up to 3 GW vs within-day forecast and even more vs day-ahead. The difference between actual and curtailed wind output (ie volume curtailed) widened rapidly after 06:30 and stabilised around 4–5 GW curtailed—likely due to grid export constraints or inertia issues, especially since demand was ramping at the same time.
The within-day forecast adjusted sharply after 10:00, but still lagged behind actuals, highlighting the limitations of short-term forecasting when conditions change quickly (wind ramping faster than models expected).
This level of discrepancy (17% of actual demand) was incredibly difficult for the control room to manage and would typically trigger substantial re-dispatching, with wind curtailment, turning up CCGTs in the BM and changes to interconnector flows.
Interconnector flows were often contradictory
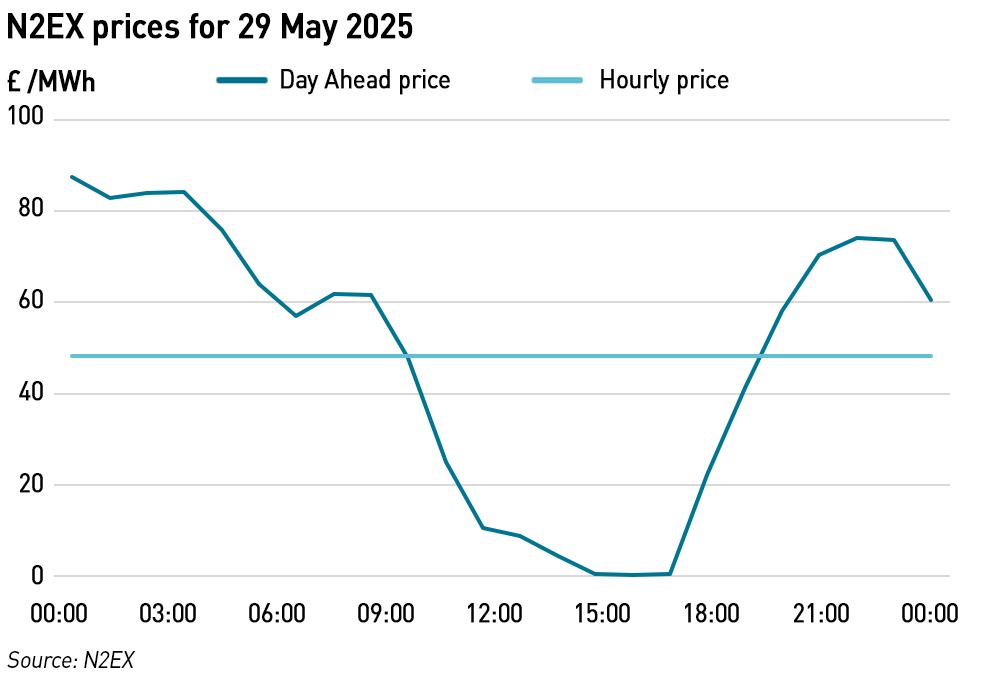
Interconnector flows demonstrated multiple changes of direction and contradictory flows. Interconnectors flow from the higher to lower priced market, and expected high wind output depressed GB power prices for today.
The day ahead and hourly prices for GB on N2EX are shown below. In the middle of the day, GB power prices fell close to zero:
NESO made 5 interconnector auction trades during the day up to 2pm, all of which were exports. All were at negative prices, meaning that although GB was exporting (selling) electricity, it incurred a cost of £53,775 to do so (for 3.9 GW):
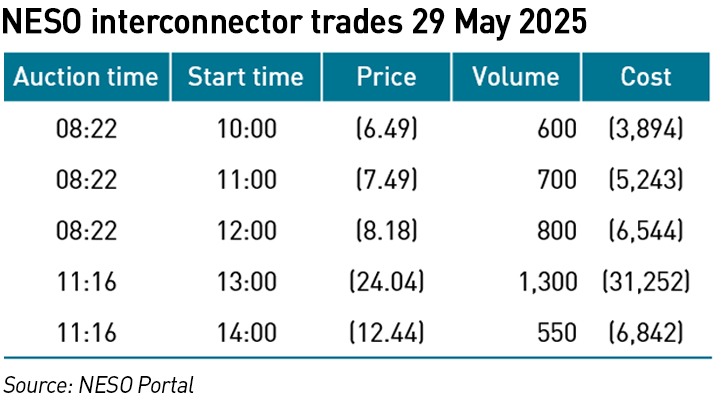
Of particular significance is the fourth auction for 1.3 GW which was carried out under 2 hours before the start of the desired delivery period.
GB was paying France/Belgium/etc. to take its excess power. This is indicative of oversupply conditions, driven by: high wind output, limited domestic absorption and grid constraints preventing internal redistribution.
Up to 2pm today, NESO also entered into 1,400 SO-SO trades on the interconnectors – these are transactions with the system operator of the connected country – in this case Ireland: all the SO SO trades were over the Irish interconnectors. Each trade was for a volume of 25 MW and the net volume for the period was zero. However the value was £2,783,259. This imbalance between traded energy and financial outcome is a clear indication that these transactions were not to do with resolving an energy imbalance, but were more about managing grid constraints.
Ireland has very low inertia, and as a result, grid stability issues can arise quickly, especially under high renewable conditions – as wind output was high in GB it will also have been high in Ireland. NESO trades with the Irish TSOs (EirGrid or SONI) are usually bilateral emergency support trades (not market-based) and are used to resolve real-time system issues. Since the trade value was positive to NESO, this suggests that Ireland was having bigger issues with its grid stability today than GB was.
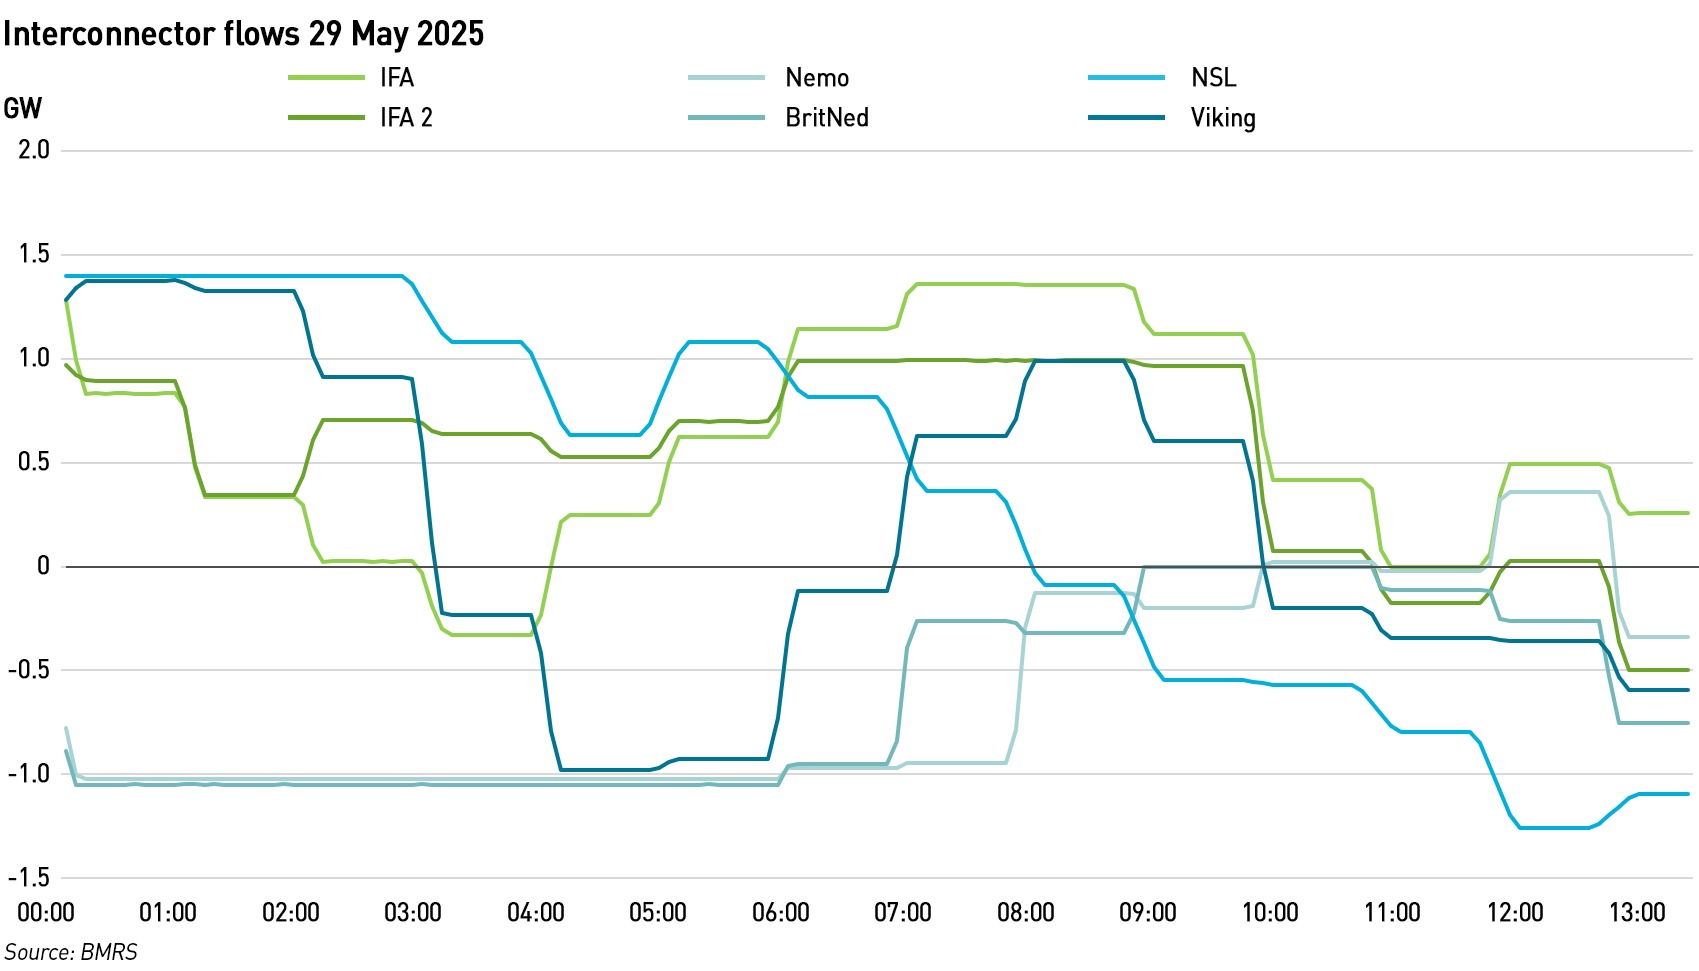
The chart shows the multiple changes in flow direction on the interconnectors with Europe. There were times when GB was importing from France over IFA2 while exporting over IFA 1. Similarly there were times when it imported from Scandinavia over NSL while exporting over Viking. For most of the day the trades with Benelux (Nemo and BritNed) were both exports.
The French cables land at different grid locations – IFA in Kent, IFA2 in Hampshire (Eleclink was on an outage yesterday). The opposing flow directions imply regional imbalances within GB, which is likely in the context of the limited ability to transmit wind from Scotland to the south of England.
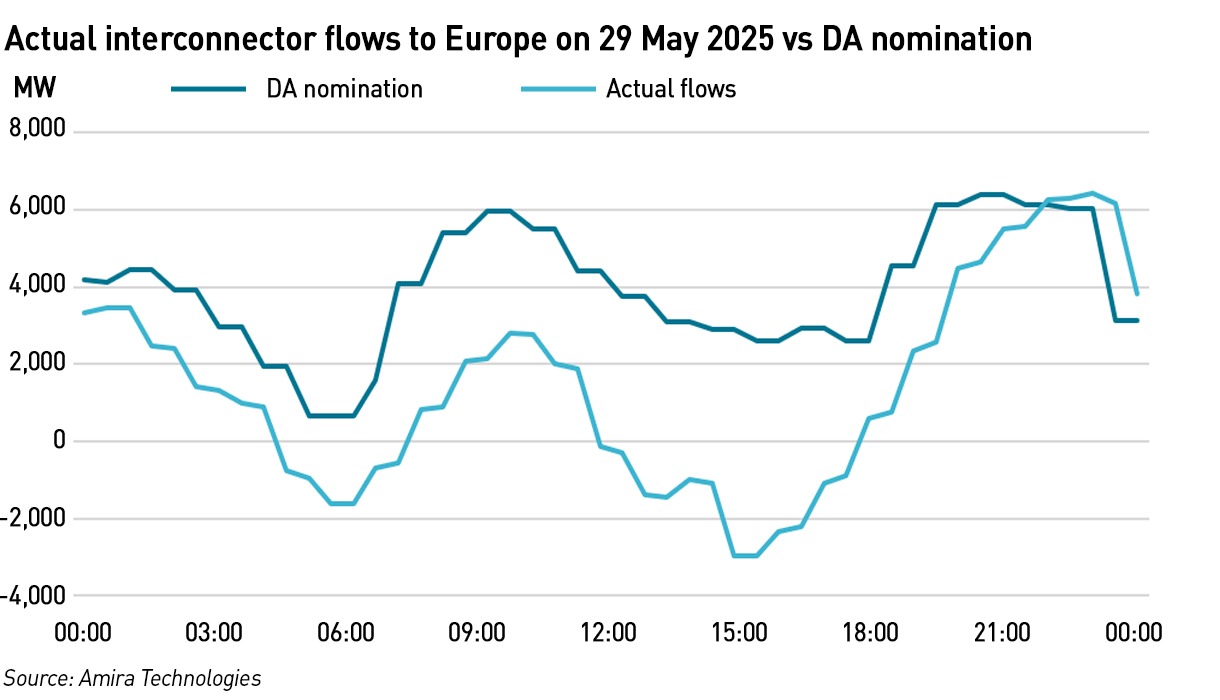
For much of the day, the interconnector flows were significantly below the Day-Ahead nomination. This is consistent with wind generation being lower and demand being higher than forecast.
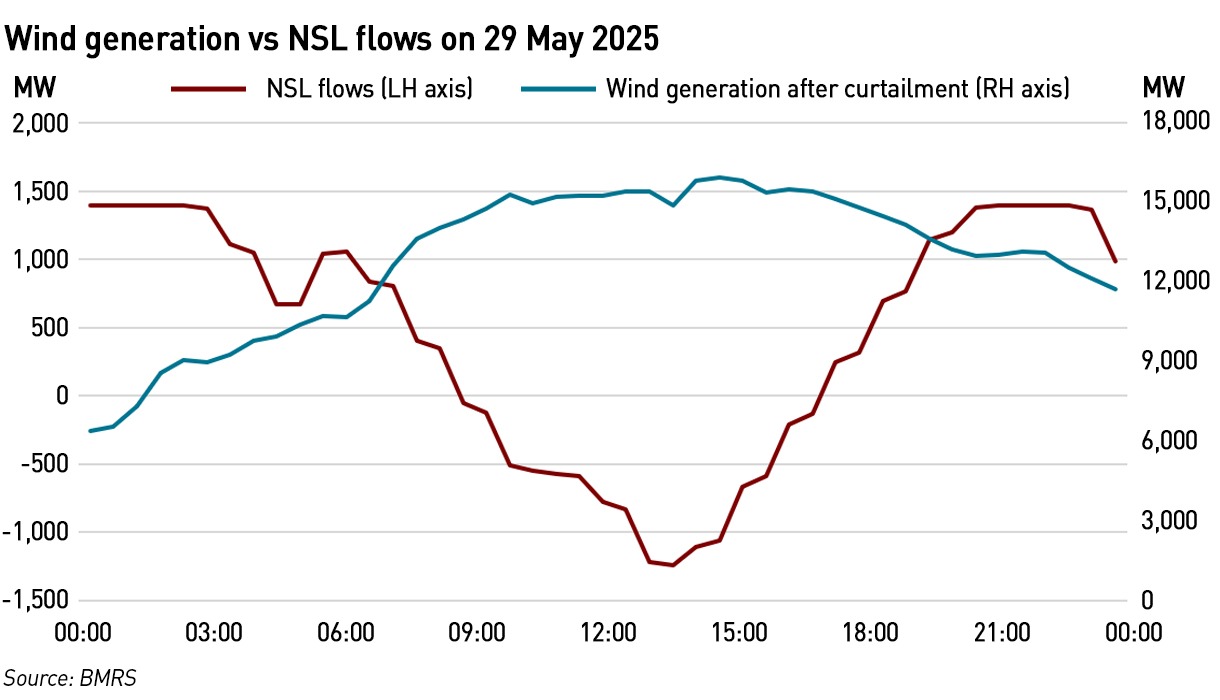
Just as the IFA interconnectors arrive in different regions of GB, so to do the Scandinavian ones: NSL lands in Northumberland and Viking lands in Lincolnshire. NSL is Britain’s most northerly interconnector, making it ideally placed to export wind from Scotland and northern England into southern Norway. So why, on a day of surplus wind and curtailments, was GB importing via NSL? To be fair, as the day progressed, NSL did switch to exports, but the net position for the day was an average of over 800 MW of imports.
GB imported over NSL in the early morning when wind was ramping. During the wind peak, exports occurred, but not enough to reverse the overall import picture. The timing of the wind ramp and the forecast errors described above meant NESO had to curtail output just as exports began. The position is worse given the fact that NSL does not re-trade within day unlike the other interconnectors. This means the flows are largely determined at the Day Ahead stage against wind forecasts that were higher than the out-turn even before curtailment.
This poses a real problem in the context of the fragile relationship between GB and Norway over the use of the electricity interconnector. That Norway does not receive net imports on a day of particularly high wind output in GB will strengthen the arguments of those in Norway who would like to re-negotiate the agreement between the two countries.
Lots of balancing trades on gas plant
Up until 2pm, NESO accepted 1,076 Bids and Offers in the BM for CCGTs. This activity was heavily shaped by a mixture of volatile wind forecasts, challenging interconnector behaviour, and resulting system balancing stress, particularly in managing locational constraints and system inertia.
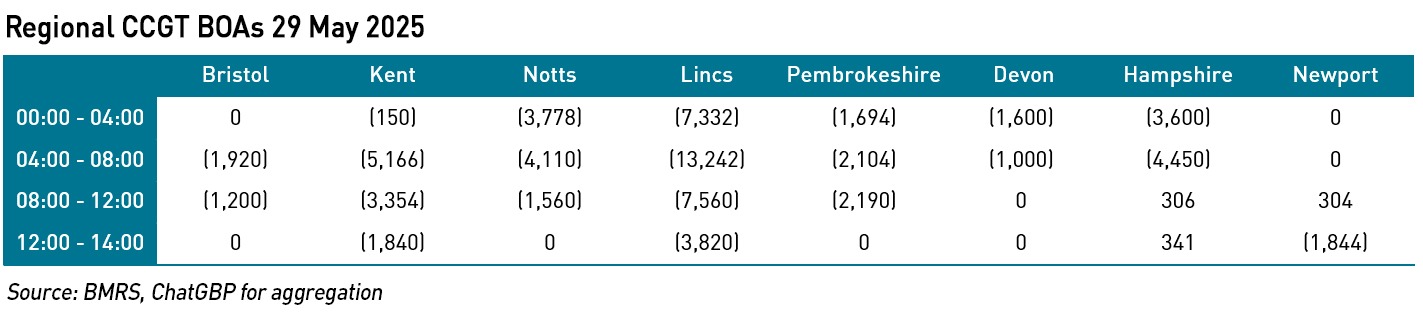
In the South of England, the Marchwood CCGT (located near Southampton) was notably active in the BM, receiving multiple bid-up and bid-down instructions throughout the day. This frequent switching is unusual and suggests it was being finely controlled to support local voltage or inertia conditions—possibly due to heavy offshore wind generation in the southern North Sea region that could not be exported as forecast. Indeed, the data show that Marchwood was ramped up strongly in the morning and bid down in early afternoon, before being called up again later. This pattern coincides with shifts in wind output and changes in interconnector flows (IFA 2 lands nearby).
Further east, Grain also saw periods of ramp-up, consistent with the pattern of trying to support the southeast corner of the grid when Viking and IFA flows were shifting rapidly. Both IFA and Viking showed multiple direction changes, while IFA2 sometimes flowed opposite to IFA, as noted above, which suggests system constraints rather than pure market economics were at play.
In the Midlands and North, CCGTs such as Staythorpe, West Burton, and Keadby were largely bid down, which is consistent with high local generation from wind and solar and perhaps reduced demand relative to expectations. It indicates that these plants were not required for energy balancing but may have been held back to avoid exacerbating local constraints.
In Wales and the Northwest, Deeside and Rocksavage were bid up more consistently, again pointing to local balancing requirements or constraints in exporting Welsh wind generation eastwards. Deeside’s activity is particularly interesting as it straddles both North Wales and North West balancing zones, a region often constrained by transmission bottlenecks.
In Scotland, as is often the case, CCGTs were mostly inactive, consistent with the region being dominated by wind and hydro and typically subject to curtailment rather than thermal ramp-up.
The overall pattern is consistent with a day of complex system balancing. Poor wind forecasts, particularly in the early morning where forecast overestimates were up to 3 GW, left the system short. As curtailment increased, the control room was forced to rapidly call up thermal capacity. However, with significant export commitments locked in by Day-Ahead interconnector nominations (particularly via NSL, which does not re-nominate intra-day), these thermal units were required not just to meet internal demand but to fulfil export obligations. Most of the rest of the interconnectors did re-trade within day, with overall flows being significantly below the Day-Ahead nominations for much of the day.
The BOAs reflect this challenge – CCGTs were flexed up in regions near interconnectors and where voltage support or inertia was needed (South, Southeast). Elsewhere, where demand was better met locally by wind, CCGTs were bid down. The bid-up activity of Marchwood, Grain, and Deeside, interspersed with down instructions, shows how tightly the system was being tuned. Meanwhile, interconnector flow volatility reflects either forecast error management or attempts to re-optimise export paths intra-day. The lack of STOR dispatch in the data suggests the situation, while strained, remained within manageable operational limits, but only just.
.
In summary, yesterday was windy, but less so than expected, and a combination of high wind, poor forecasts and interconnector trading led to a very high level of activity in the BM with significant curtailment of both wind and thermal generation, but also significant local bidding up of CCGTs in order to meet export requirements and maintain grid stability.
.
.
Note on market data
This analysis has taken far too many hours to carry out, indicating the difficulties of understanding the market from official data. The first time I downloaded the BOA data, there were missing entries, so several hours of work were wasted (I realised there were missing data because I checked some individual BMUs and found discrepancies). Official data on BMRS do not include interconnector nominations at all, so I had to use Amira Technologies for these data. Also, the presentation of a lot of data on BMRS is unwieldy. For example, the generation by fuel data puts each different fuel into rows rather than columns, so in order to create charts like the ones that can be seen on screen at BMRS, it is necessary to re-arrange the data into columns. In general, data downloads from BMRS require some degree of processing before they can be used.
I have also been trying to analyse the frequency data over the bank holiday weekend but found junk data which Elexon is investigating with NESO. For example on 27 May there is a couple of hours where the frequency was reported as exactly 50.0 Hz for an entire hour, except for a few zero values. Neither 50.0 Hz nor 0 Hz are credible, particularly for multiple consecutive settlement periods.
I have also been trying to analyse daily balancing costs from the NESO Portal. However the most recent data are from 20 May, and in several of the historic data sets there are missing settlement periods (not related to daylight saving). I have asked NESO why this is and have yet to receive a reply.
There are very many different sources of GB market data, on BMRS, the NESO Portal and various dashboards such as Amira Technologies. However in order to properly understand the market it is necessary to use data from multiple sources, clean and re-format them and try to pull them together into something coherent. This is extremely time consuming. It is very difficult to quickly understand what is happening in the market – the picture yesterday was relatively simple: a mixture of high wind, poor forecasts and grid constraints. But there is no single place where this story can be easily seen, it has to be pieced together from different sources and inferred (for example there is no real way to view the constraints, only the impact of the constraints).
As the complexity of the market increases, it is more important that data are published in a timely fashion, that they are correct and complete, and that more is done to aid transparency.
Well done Kathryn, I learn so much from your excellent contributions and I have been in this business for nearly 55 years. It reinforces for me that we are still in the data gathering phase of many issues that need time and detailed understanding before we move to fundamental change such as locational pricing etc which is , at times, being driven by what I term as ‘instant wisdom’ and not robust data and detailed analysis!
Extraordinarily complex piece of sleuthing which only KP could achieve. The system is pockmarked with a slew of competing generation and grid weaknesses requiring a real time string and scotch tape approach. All with no reliable connected data platform. There is zero possibility of anyone in UKGov, let alone Miliband, understanding a fraction of this and of the supply amd economic dangers this hotch potch poses.
If you are unable to collect useful data and after the event rather than real time, how on earth is it possible to manage the network efficiently and effectively? The system,as you describe it, appears to be chaotic. I would suggest that effort should be focused on making the existing system more effective rather than endlessly building more wind farms.
Fascinating analysis of the complex UK generation picture. It appears that there are so many balls in the air at any one time that sooner or later someone is going to drop one!
Thank you Kathryn. Very interesting.
It is clear why this all takes hours for you to produce. It may be possible to do even more of his work using AI and somehow present you with a set of data to check for glaring anomolies (using your experience and intuition) and amend before progressing to the reporting and graphing stage.
Not wishing to add to your burden, would it be possible to spell out acronyms in your work, even for the first couple of occassions in the articles, as amateurs like me struggle to understand CCGT, BMRS, IFA etc. I did of course go and find out and I hope that these will gradually sink in to my slow brain eventually. 🙂
If you check and amend the articles using AI you can add a single prompt to do this acronym work for you.
Thanks againKathryn and either way I will continue learning journey with you.
Best wishes.
Thank you for another excellent analysis.
Id like to build a model which instantly calculates the downsides of getting the wind forecast wrong.
And, on the subject of forecasts, there is no way that the forecasts for future wind amounts can be accurate.
In theory, we could have 30 years of negligible speeds, or speeds so high the turbines have to be switched.off.
Until the next 30 years have passed, no one will know, so any current mathematical modelling should be filed under – suspect.
I first did an IEE visit to the CEGB bankside control c45 years ago and its was staffed by less than a handful of people and was an air of tranquillity as all those big steam sets rhythmically sitting there at or about 50Hz with their governors keeping them in check. Todays replacement at Wokingham has dozens of people in front of screens managing the consequences of the overly complex system we have created which your article aptly shines a spotlight on.
Anyhow back to your article NESO did report in this weeks Operational Transparency Forum that over last weekend (high wind solar low demand) they observed high levels of wind units voluntarily deloading when prices went negative especially ones that don’t site behind SCOTEX grid boundary. So was this an issues yesterday presumably not as price never went quite negative on N2EX. Furthermore pretty well all the Scottish boundaries are running at reduced capacity currently due to summer maintenance and outages for ironically grid reinforcement or connections for more windmills. Irrespective of the climate argument I continue to find it bizarre that we keep adding more and more generation in Scotland without fixing the grid constraints first. The grid construction activity currently ongoing upto 2030 and beyond wont even neutralise todays problem give more generation is already under construction.
Brilliant Work.
Shines a light on areas some people might not wish us to see.
For the layman, would the picture be anywhere near easier, and cheaper when relying on gas/nuclear rather than wind?
Very well done, laborious! This is like trying to unravel the excess death stats, of course obfuscation and calculation method changed making it almost impossible to get a simple comparison as was possible in the past.
Kathryn,
Terrific analysis … as you had trouble with the data, I’m wondering if you could post/email the source data that you do have and I’ll have a go at it using different tools (Python with Panda). I’m doing that with the frequency data from NESO using 1-second data from 2014 and beyond. Part-time and eventually I’ll put on my Substack the second set of observations about thresholds, in addition to the histograms of frequency by year already there.
“Wind output was forecast to be above 14 GW for much of the day. This pushed GB power prices down” – I thought prices were determined by the marginal generator which, we were told, is always gas?
Is it cheaper to export surplus wind power via an interconnector at a loss than to compensate a wind farm for telling it to feather its blades?
Actual versus forecast wind chart. “Between 06:00 and 09:00, actual wind output (before curtailment) exceeded both day-ahead and within-day forecasts” – not according to the chart, if I am reading it correctly. Within-day is unquestionably above all other curves. As for day-ahead, I’m not sure due to use of three very similar shades of bluegreen, but before-curtailment looks to be below day-ahead. There are other colours in the spectrum.
I am frantically googling to keep up with all your acronyms. But you are slowly educating me so thanks for that!
When it’s windy or sunny gas ceases to be the marginal generator. Any gas that runs typically does so to provide grid strength for inertia, voltage control/reactive power and short circuit current. Often this is disguised because the payment is labelled as replacing curtailed wind instead, but it is a reality of curtailment and turn-up. Price is set by the balance between supply and demand. Here’s a chart I made of generation, interconnector flows, pumped storage activity and day ahead IMRP prices used in CFDs covering January 2023 at hourly resolution (best viewed on a laptop):
https://i0.wp.com/wattsupwiththat.com/wp-content/uploads/2024/08/Generation-jan-2023-1722888879.3157.png
You can see that in the first couple of days we saw some high peak prices – a sort of pre-echo of the January 8th incident this year which Kathryn has analysed in depth – caused by a shortage of available capacity, so prices get set by what it takes to reduce demand either here or abroad – you can see e paid enough to get the Irish to export for the peak on the 2nd, and that might have been at the expense of some of their industrial use – so the price was actually set by demand via an interconnector.
That is followed by a number of much windier days for the rest of the first half of the month. There is some gas running in every hour, along with stable output from nuclear providing core stability for the grid: biomass and coal show some variation, typically turning down overnight when surplus wind forces prices close to zero at times. Interconnectors switch between importing during higher demand hours and exporting during low demand hours, with pumped storage also taking advantage of low overnight prices – it takes advantage of . When demand is lowest on the weekend Ireland exports its surplus from similarly windy conditions to help balance its grid: it also imports during higher demand hours for the same reason. Every day the prices see wide swings, and it’s obvious that gas plays no role in setting them – it’s all about how much competition there is to ensure that wind gets produced to harvest its subsidies. Remember that for CFDs, so long as the price is positive, they do not care what the day ahead price is, since the CFD will simply top them up to their strike price. Renewables on ROCs which pay a fixed sum per MWh of generation likewise are far keener to ensure they earn their subsidies (especially those being paid more than 1 ROC per MWh of generation). You can see that there are some small adjustments of CCGT output to accommodate the limited solar output at this time of year.
In most of the rest of the month wind output is much lower, and the supply becomes much more dependent on gas. Mostly this leads to much more stable prices, even when France needs to import (presumably they still had ongoing nuclear power outages), although we do see some price spikes.
There is further trade that occurs after the day ahead prices are set, right up to gate closure, an hour before a half-hour settlement period starts: the volumes are really about fine tuning positions to be a closer match to anticipated demand or taking account of late changes in weather forecasts. Indeed, some trade takes place live via the Balancing Mechanism with NESO deciding which bids and offers to accept to keep the system balanced overall and geographically taking account of transmission constraints and the need to maintain stability. The prices are paid as bid, but do not include any subsidies for extra generation, which are billed to consumers via different routes.
What is not widely realised is that most of the trade in the day ahead market and later is not really about outright purchase and sale of electricity, but instead it’s about swapping more supply to meet peak demand for less supply in the middle of the night, or swapping earlier purchases made as part of a hedging programme for renewables that are now reasonably certain to generate with the weather forecast being in. Moreover, much of the trade in in the OTC market, and so the idea of ranking offers to generate and accepting all the cheapest up to a clearing price really doesn’t apply. The Nordpool and Epex Spot markets do nominally run as auctions, but most of their role is really in setting the transfer price for CFDs hour by hour and determining which pocket pays how much of the strike price. What matters to the retailer is the difference in price it pays for swapping from one time to another, not the absolute price levels on each transaction: where the differences are large there is a large additional cost from making the swap, so these costs are much higher in volatile renewables dominated markets, and low when gas supply adds stability (gas is traded on the basis of the gas day rather than balancing from minute to minute or half hour to half hour, with the flexibility of storage in the pipeline network through varying pressure providing a buffer). CFD generators may use the auction because it gives them a back to back guarantee that they will end up with their strike price when they sell at the auction clearing price. Or they simply index their sale price to the auction result, which is quite common for framework deals to take a share of a wind farm output.
In fact, most of the cost (aside from the cost of subsidies) is set for retailers through their advance hedge purchases which they make in order to be able to meet the OFGEM cap price or to be able to offer price fixes to customers. These purchases are made over time, some of them many months ahead of actual supply. Who are the sellers? Dispatchable generators who can be sure of their costs and of a high probability of being able to generate to supply the volumes they sold, taking advantage of opportunities to lock in a margin with some profit. This includes nuclear, biomass (and coal in the past) as well as CCGT. Coal and gas have forward markets for supply that allow fuel cost to be hedged – and coal (and historically, oil too) power stations also have large stocks on hand and a cost they know. The nuclear element includes nuclear from France, usually coupled to purchasing interconnector capacity. It does not include renewables generators because they have no incentive to sell on a forward basis. If it turned out that the day ahead price was higher than they sold for they would lose out compared with selling on a day ahead basis: it adds risk. Worse still, if it isn’t windy they could find themselves paying top dollar to purchase coverage for volume that had sold but can’t supply. These hedges are sold on a block basis: baseload is the same volume 24×7 for a month, quarter or season. Peakload is the same volume continuously between 7a.m. and 7p.m. Monday-Friday, typically over a month or a week. As delivery approaches trade begins to happen in sub blocks of time to match demand more closely, with the final trimming in the day ahead and intra day markets. There is no auction in these markets: they are “over the counter” bilateral trades at fixed negotiated prices. A fair amount of the overall volume is of course based on gas – at least while we still have CCGT capacity available.
When the day ahead stage is reached, CCGT generators who have sold output to retailers ahead of time can bid for offered renewables to supply the sales, keeping the gas or reselling it to a gas supplier for use another day: they will do this where making the trades is more profitable than proceeding with their original gas purchase and power sale. But the price at which they are able to make the swap is really dictated by the extent of renewables supply – in the short term we have renewables driving the gas price, not the other way around.
Thank you for this excelkent analysis Kathryn, incredible that you were able to develop the explanation so quickly considering the difficulties that you experienced in obtaining and verifying the data. Your work is so important, particularly in these highly charged times when there are some who promote renewables as the panacea to the world’s problems.
Just for your information, I am a retired power system protection engineer who spent my formative years with the CEGB but later worked with ABB, Reyrolle and Toshiba.
Am I correct to assume the wind generators still got paid the CFD strike price even though the market price was zero?
The rules vary. So long as the price is zero or positive, intermittent CFD generators get paid. At minus 1 penny per MWh or lower the oldest CFD contracts pay the full strike price, but they have to absorb any negative element. The next tranche of contracts does so so long as there are not 6 or more contiguous hours of negative prices, when they get paid nothing for the entire duration of negative prices. The most recent ones pay nothing for any hour when prices are negative. ROC generators continue to get ROCs for every MWh they produce regardless of the day ahead price, so the ones with multiple ROCs per MWh in subsidy only curtail when there is a transmission constraint.
Am I correct to assume the wind generators still got paid the CFD strike price even though the market price was zero?
Kathryn – Thankyou so much for this brilliant and thought provoking piece – and for your rapid yet painstaking analysis. It’s really useful to be able to follow your lines of enquiry and see how they underpin your insights. It is remarkable how opaque and error-prone the data and mechanisms for accessing it seem to be. I’m very grateful for your perseverance in pursuit of truth. I hope your salient synthesis shows those responsible for stewarding the data both the importance and power of maintaining data integrity.
As Hardy said to Laurel, “That’s another nice mess you’ve gotten me into!”
The state of reporting is dire (and worse in Europe, where it has taken an independent source of frequency information to reveal what was happening across the continent in the minutes ahead of the Iberian apagon). It is a wonder the Control Room has sufficient information to make the right calls, although they have access to different channels not open to the rest of us.
The business with interconnectors is quite complex. The UK is no longer a party to the European automated clearing system for interconnectors which links trades and capacity via implicit auctions and dictates the net flows via the EUPHEMIA algorithm that is supposed to result in the least cost across across the grid – although it sometimes throws up perverse flows from a higher to a lower price region, allegedly because the prices do not fully reflect grid and other constraints. The government has actually agreed to re-link into the system, but on what terms and from when is unclear.
https://www.newpower.info/2025/05/ukeu-agreement-could-see-uk-rejoin-blocs-energy-markets/
The result is that interconnector capacity is auctioned quite independently from trades of power at each end to use it. Typically, France will buy a good tranche of capacity on IFA1 well ahead of time in the expectation that they will be supplying nuclear surplus to GB. There have also been extended periods when NSL has operated as a baseload supply from Norway. It used to be the case that BritNed also operated fairly consistently to export to the UK, based on the coal/woodchip cofired MPP3 power station at the Dutch end, but that has been hammered into disuse since the spring by Dutch solar surpluses. There are now huge arbitrage margins at times across the interconnectors, with a lot of the price difference going to the interconnector owners for capacity, particularly when an interconnector is in full use on one direction and prices cannot be rectified by competition from extra capacity. Furthermore, once capacity has been sold the holder can threaten to use it in a perverse flow unless a counterbid offers a higher profit. Because perverse flows prevent price convergence, that can provide an opportunity to run a long position on the high price side and a short position on the low price side that can be more profitable than trading for price convergence and removal of perverse flows. When National Grid owned the control room and the UK half of most interconnectors there was a clear conflict of interest with conducting SO-SO trades or intraday interconnector auctions. Perhaps the worst cases involve contraflow on Eleclink and IFA1, which start and end at the same point each side of the Channel – so electricity literally ends up going around in circles, boosting interconnector income. Not far behind are the implicit circular flows involving NSL, Viking Link and the interconnector between Norway and West Denmark, and likewise via BritNed/NEMO and IFA1/Eleclink and across Kent – although the latter route was apparently used to deliver extra power to France during their major nuclear shortages in 2022. The flows otherwise are probably more due to entrenched trading positions than physical balancing of the grid geographically. Trying to understand them involves analysing the nominations and metered flows by trading party, which is untransparent given the codes used in the official data. Some imbalances may be taken through all the way to BM settlement, “Chasing the NIV” (net imbalance volume priced at System Price under balancing). The volatility of those prices and at times extreme and protracted divergence from day ahead prices suggests a lot of trading influence, although unpredictability of wind can play a part.
I didn’t catch the LCP Enact estimate of balancing costs for the 29th, but I did see what happened on Sunday and Monday, where the balancing costs were ~£15m each day. Paid for curtailment was 75+GWh each day, but in addition there was a very substantial volume of voluntary curtailment by CFD wind farms who were getting no CFD compensation because day ahead prices were negative, including on Sunday some who were denied compensation because of the number of consecutive hours of negative prices. This fundamentally altered the pattern of curtailment, which became dominated by offshore CFD wind farms that normally would not bid competitively to curtail. Some were actually partially reactivated by being paid to turn up generation in the balancing mechanism. At
the peak, there was 6GW+ of curtailment. These conditions create another raft of uncertainty for NESO. There was also a very substantial volume of exports at negative prices that has been subsidised by UK consumers. Analysing the true cost is probably tricky, but I note your analysis that on the Monday exports could have been provided by CCGT turn-up. It would be part of BM payments, so not quite the same cost as say an ROC subsidy to keep a wind farm operating despite negative wholesale prices, which would be additional to BM payments.
It seems there are cans of worms wherever you look these days.
Very interesting analysis.
I sailed by car ferry from Troon to Brodick (Isle of Arran) on Thur 29 May. The weather forecast was for very strong winds and the ferry company warned of possible service disruption. The wind turned out to be light and the swell was barely noticeable.
I’m reminded of a converse situation a few years ago when we suffered a local (around Inverness) power cut which I’m sure was caused by a sudden surge in wind supply. My anti-wind farmer colleague said it coincided with a sudden violent squall which blew his barn door off! The authorities denied that the power cut had anything to do with wind farms, of which we have lots, but they would say that, wouldn’t they (cf. the recent Spain outage). I think this post from my farmer friend refers to it: https://windfarmaction.wordpress.com/?s=Power+cut&submit=Search.
Incidentally, further to your recent comment that “wind and solar … are fundamentally incompatible with the way our grid was designed to operate”, it is interesting to note that the word “inertia” does not appear at all in the late Prof David Mackay’s 2008 opus (383 pages) “Sustainable Energy — without the hot air”: https://www.inference.org.uk/sustainable/book/tex/sewtha.pdf.
If the Chief Scientist of the time was unaware of this fundamental incompatibility, you can be sure that none of the climate activists and politicians did either. I don’t think I cottoned on fully myself until the localised UK power cut of 2019. I did question the then Energy Secretary (Anthea Leadsom) as to the wisdom of adding more and more non-synchronous renewables to the grid, but I got fobbed off.
Re: Prof Mackay 2008 work – I think it might be a technology change..My recollection is early wind turbines were synchronous and as a result suffered with reliability issues as their dynamic changing torque loads reacted against the rigidity of the grid. At the distance I follow these things, I think advances in power electronics allowed turbines to become “un synchronous” improving reliability (and yield I suspect). The downside has been loss of rotating inertia. A quick search pulled this up from 2023 which suggests things might be going back the other way:
Synchronous Wind: Evaluating the Grid
Impact of Inverterless Grid-Forming
Wind Power Plants
Preprint
https://docs.nrel.gov/docs/fy23osti/84609.pdf
Not really. Inertia scales with mass x distance from centre of rotation, and the square of rotation speed. You can consider a turbine blade to be a bar, for which the integral of mass x distance is (ML^2)/3, so for 3 blades is ML^2. Early turbines were under 40m blade length, with a weight of say 15 tonnes. Rotation speed is around 20rpm: larger turbines rotate slower, because the limitation is blade tip speed. A gas turbine will weigh several hundred tonnes, and although its radius is on the order of 1m (and the integral can be considered as (MR^2)/2, it rotates at 3000rpm. It’s the rotation speed that stores much more energy.
I know David Mackay used to read Energy Matters, and very occasionally popped up a comment, but he died in 2016, somewhat before this erudite discussion of ancillary services for Ireland (there are contributions from some with far greater technical knowledge and experience than I), but reviewing the comments I see they included a number of very pertinent facts about the difficulties of dealing with unstable grids with high renewables penetration.
https://euanmearns.com/beyond-the-spin-of-green-energy-storage/
Thanks IDAU – that is a very useful link and discussion.
To be honest – hats off to the people keeping the power supplies running in such a web of complexity.
And all hats off to Kathryn for this extraordinary work. I struggle with the details but it is explained so well I feel I can start to grasp the disquieting landscape. Many thanks.
Kathryn you are to be commended on a monumental relevant & timely body of work.
How long can this renewable insanity continue ?
Not only having to cope with intermittency we also need to accommodate varying wind speeds.
Our aging fleet of CCGT are taking a battering, 2 shifting, ramping up & down must be taking its toll.
We are a crowded island with a population approaching 70 million.
I’m convinced more than ever that we need 100% UK energy security.
Here’s my 80/20 overall view:
Big Nuclear on existing coastal sites, pumped hydro, future fast breeder reactors down the line (yes)
Deep mined coal (no)
Gas from fracking (maybe)
North Sea oil/gas (possible)
Tidal Barrages with embedded 2 way turbines beneath a toll free road linking deprived coastal communities (to late I fear)
For the past 50 years thousands of people have returned home from work, switched on the lights & cooked an evening meal with never a thought that it wouldn’t be there, that’s what 99.99% network availability looks like.
Finally green hydrogen at scale has little chance without very low cost electricity, only nuclear can provide that.
Barry Wright, Lancashire.
An excellent analysis given on such a brief timescale.. Having experienced a decade on shift under nationalisation followed by a decade under privatisation as a grid control engineer I have no doubt of the former having a better way of operating the grid system. The market system introduces a raft of price parameters that can only deflect from essential operating conditions that demand engineering judgement. The fewer involved in decisions the better. A visit to national system control revealed the scale of operating staff elsewhere.
We are running our grid on a wing and a prayer. It will continue to be vastly expensive and complex unless we ditch most of the unreliable weather dependent power generators. The system we have now is designed to fail.
I’m new to this and find the whole thing fascinating. Your blog is hugely impressive.
It is quite striking how much of a part pricing has to play, and pricing seems to be almost random and certainly unfair to some.
Wouldn’t it be better to concentrate on an efficient grid system and sort out the pricing allocations, say, the next day?
Exactly, and we have already committed to spend £60 billion to do so. We are in danger of trying to ‘fix the the plane while in flight’ .
Does anyone here have any insight into the make-up of the “other” category in the generation mix? (https://gridwatch.co.uk/)
It is currently producing 1GW,(at 2.30pm on a windy, sunny day while Wind and Solar are at a maximum – so, it is unlikely to be batteries discharging?) and I often see it rise over 2GW, so it is not an insignificant proportion of our energy mix.
My suspicion is that it may be “diesel farms” e.g. https://www.theguardian.com/business/2016/dec/06/diesel-farms-national-grid-tax-breaks
Is Britain resorting to burning 1GW of Diesel purely to try to control the instability caused by 18GW of Wind and Solar?
Or perhaps batteries really are discharging, but only south of the constrained B6 border?
I really wish NESO/Elexon would pull Batteries and Diesel out of the “Other” category so that we could see what is really going on!
The Other category is supposed to cover transmission connected generation not otherwise specified, so it might include some transmission connected solar, but that is as yet small. Things that are connected at the distribution level are largely ignored by the Control Room, although that is beginning to change. They have special arrangements for STOR, the short term operating reserve, which is partly distribution connected. You can review what they have been procuring in their daily auctions here:
https://www.neso.energy/data-portal/short-term-operating-reserve-stor-day-ahead-auction-results/stor_da_auction_results_
Gas reciprocating engines rather than diesel per se figure for that. However, STOR is rarely called on to generate – only when supply is tight, like on January 8th. Most of the Other category is now batteries, with capacity increasing rapidly as some big units have been commissioned (e.g. Blackhillock), and now runs to well over 4GW at an average duration of about 1hr 40min. There is a significant volume of battery capacity connected at distribution level, but that has been campaigning to get included in Balancing Mechanism trading, and now has its own direct routes to the Control Room. It may surprise you to think of batteries discharging when prices are low, but they are providing a range of services, rather than purely trying to charge up cheaply and discharge during price peaks. On windy days NESO are relying increasingly on batteries providing synthetic inertia by charging or discharging at a rate proportional to grid frequency deviation from 50Hz, using up to +/-1.4GW. They may also be discharging in order to create headroom to charge up either to provide ancillary services they agreed to, or because they can charge even cheaper soon. Or they may have played a trading game against the Control Room and lost – expecting to be paid not to discharge and finding that they are being left to suffer a very disadvantageous balancing price.
What is clear is that the readily available Elexon data on batteries is poor. You have to wait until settlement metered data is available to even begin to get a picture of battery charging, which is otherwise a hidden element of apparent demand. Even that disguises what happens inside each settlement period, as a battery may spend some of the time charging and some of it discharging – or it might be static. That makes it hard to evaluate battery round trip performance, because you only see the net charge/discharge per half hour instead of the totals for each. I complained about all this to Elexon (and some other issues) once they had the bulk of the present system in place, and I was told that maybe sometime they would get around to fixing it.
A great piece of analysis Katherine.
The phrase “I know it’s right when it’s simple” is often attributed to Albert Einstein but the landscape you paint is far from this and looks absolutely chaotic. One wonders is this a result of unnecessarily complexity or by design? Data accuracy is all to ensure accurate forecasting and costings. But do you feel data is being withheld to prevent the true cost/impact of net zero being transparent? Surely the forecasting models are a prime examples to apply machine learning/AI to improve their accuracy/effectiveness but this does assume NESO, HM Gov et al have a desire to let the Genie out of the bottle i.e. giving the true costed picture.
A couple of things come to mind reading this report are the issues raised by Alex Epstein in his book Fossil Future where he refers to the Knowledge System, which the above is part of, but this has been established and enhanced by Research, Synthesis, Dissemination and Evaluation all of which can be distorted to suit different narratives. The energy environment is a prime example that reflects a quote attributed to Peter Drucker being “If You Can’t Measure It, You Can’t Manage It”. I believe it demonstrates a lack of process definition maturity necessary before measurement can be applied repeatably and effectively but made all the more complex as its currently driven by questionable net zero goals.
Why are we still running CCGT as separate power generators, not embedded in the economy in other businesses/universities/hospitals/Army bases/Navy bases/Air Force bases?
We are paying for the CCGT capacity and all the large scale entities have their own back-up supply if the grid fails.
We wouldn’t need separate “frequency response services” if they only designed the grid right in the first place. With a fleet of 1000 20MW wartsila engines there is embedded frequency response in the nature of the engines being used which can easily be throttled up and down.
There are so many people who talk of duplication of wind and solar, and then CCGT to back it up when the wind doesn’t blow and the sun doesn’t shine. At the moment for some organisations, there is an internal back-up in some large businesses and hospitals and military installations, making us pay for not just one system of back-up to the wind and solar, but we are also paying for the universities, hospitals and military installations for a second layer of back-up.
How many layers of back-up do we need?
Shouldn’t we be turning the universities, hospitals and military installations into the primary back-up, replacing the CCGT, where efficiency gains through using CHP will be achieved.
Everything in silos, no “thinking outside of each functions limited box”, a prime case for a DOGE effect that could shave BILLIONS off the cost of running this country.
Renewables would be cheaper, if only the government actually understood how to achieve it, and having CCGT facilities (companies) separate from the huge sprawling national facilities that use significant amounts of power and HEAT isn’t the way to achieve it.
We could easily switch over to Wartsila 20MW 50% efficient engines that when installed as a fleet in universities/businesses/NHS hospitals/army bases/airforce bases/navy bases, which don’t have a problem with being run and throttled up and down, and stopped from time to time. If we need 20GW, that’s 1,000 engines. How many businesses, hospitals, universities, army bases, navy bases, airforce bases are there in the UK? How many 20MW engines would each location need?
What is the current installed back-up generating capacity countrywide that only gets used once a year or less? How much money are the government and businesses wasting on two or more tiers of back-up?
Is the problem that the government has borrowed so much money that it needs the inefficiency to gather more tax receipts? Or is it that the government/advisers/national grid/civil servants cannot think of alternative arrangements how to generate and distribute electricity efficiently?
The Wartsila engines are dual fuel, so whilst they can run on gas, LNG they can also run on liquid fuels. Liquid fuels can be renewable, as so too can methane.
How much money would the government save if the NHS and Armed forces actually ran the back-up to the wind and solar, getting rid of the CCGTs.
Electricity at wholesale rate, not consumer rate or business rate, and free heat………how much would they save, measured in BILLIONS?
Please can all engineers reply below with their calculations, where you have a fleet of 20MW wartsila engines running at 50% efficiency.
And please indicate the additional capital expenditure savings of not having any CCGT, that we are currently paying for!…….how much could be spent unnecessarily on CCGT?
And remove the frequency response services, diesel peakers, etc.
i.e. embed everything in the hospitals, army barracks, RAF bases and Naval bases.
Take 950 hospitals in the UK, 14 Army garrisons, 80 Barracks, 38 RAF bases, 10 Naval bases…..say 1100 facilities.
What is the grand total, how many BILLIONS would be saved?
And Katherine, please include you own calculations as you are an expert on these things.
Yes the current way it is being done will cost more for everyone, but there are alternatives.
I believe that hospitals have to have 48 hours to 96 hours of liquid fuel supply as back-up, at whatever power output level they require, but what if they could also run on methane?
What is the normal back-up sizing for a hospital?
Would this ease grid faults, where we have large 1GW links/generators that are getting faults and causing problems when they drop. If one 20MW generator goes down, the output can easily be replaced by others throttling up, instantaneously.
What is the dynamic range of the Wartsila engines/generators, do we need 2/3/4 engines of different sizes, say 2x2MW a 5MW and a 10MW and or just one 20MW at each location to give the dynamic range required, or is it better to have 4x 5MW generators.
And if you want to add in 143 universities to the calculation, making say 1250 locations, getting free heating, whenever they are called upon to run, and cheap electricity. Wouldn’t that also help with the finances of the NHS and universities, and Councils for that matter if they have facilities that could also be used…….how many more councils or universities are on the verge of financial collapse?
If the country has borrowed up to 100% of GDP and the politicians are likely to be spending more and more of GDP because they can’t get a grip on the finances, haven’t they got to start finding serious gains of efficiency?……..have you seen the latest budget done by Trump?……I know that’s America, but it’s just the same over here.
How many NHS trusts are having financial difficulties, or universities or armed forces, or councils?
The problem with an ultra-high voltage supergrid, and centralised power generation, is that in times of war it is so easy to sabotage/strike numerous exposed points that cannot be guarded, or a few centralised power stations to kill off all power.
Is the key to making renewables efficient, not so much the strategy for wind/solar, but the resetting of back-up power countrywide and across many different businesses and functions to a different structure to bring in synergies that exist that no one else is currently talking about?……..even Katherine hasn’t suggested this significant change in the electricity industry. She’s right about the current structure of the electricity industry costing more with adding centralised wind and solar to centralised CCGT/woodchip at Drax/nuclear, but what happens when you stop duplicating power generation with multiple tiers of capital expenditure on the same bl%^dy thing (i.e. back-up power generators) countrywide?
With wind and solar if it were installed by the end-users, there could be plenty of cheap power available when there is an excess of wind/solar, to put into storage, avoiding the costs of constrainment and the cost of CFDs, where we still have to pay more when there is surplus, and power generators gaming the system, if only the government could think like an end-user and a real business, not a fantasy business, and start getting more in terms of real efficiency gains.
If the government doesn’t want to increase taxes, which it really needs to because they haven’t been able to increase productivity over the last 10-15 years, and the demands for NHS and defense and income support are growing at an alarming rate, it’s going to have to get far more clever about efficiency gains.
“The problem with an ultra-high voltage supergrid, and centralised power generation, is that in times of war it is so easy to sabotage/strike numerous exposed points that cannot be guarded, or a few centralised power stations to kill off all power”
Britain would not have survived the blitz without a national grid network hastily built between WW1 & WW2. Coal fired power stations featured in every city & town suppling local industry & the surrounding population at that time.
The new 132kv grid network linking all these areas allowed power stations, munitions factories etc. to be located away from populated areas. As a young engineer I worked in many war time substations in discreet rural areas. Overhead lines & towers carefully routed off the skyline, almost invisible in the landscape.
Towers supporting conductors leave a light footprint across the land exposed to sabotage & theft maybe but repair & restoration is usually swift & can be achieved in days. 275/400/750kv High voltage conductors suspended on steel towers are used through out the world as the most effective method of electricity transmission says it all for me.
Firstly the posting touches on renewables solar & wind generation. I maintain that all new builds should should be subject to solar/battery installation as part of planning consent.
Secondly on shore wind turbines should be point of use installations with 2 stage back up; no connection to the super grid. Wind farms are fine but off shore, output harvested & brought ashore by sea cables.
Barry Wright, Lancashire.
If you are really interested in the costs of running the NHS, then the following webpage is a good place to start:
https://www.openaccessgovernment.org/nhs-hospital-energy-bills/142771/
When the NHS said that it had to set aside over £1 BILLION to deal with the surging gas price back in 2022, we have to ask if 20GW of electricity if produced from 40GW of gas at 50% efficiency, that means at 5p/kwh 20GW of wasted heat, £1,000,000 per hour is being wasted when the CCGTs are being run with no CHP. If the NHS got that heat for free, effectively, how many extra operations or doctors could be paid for? if the gas price is 10p/kwh that becomes £2,000,000 per hour, if the gas price is 15p/kwh that becomes £3,000,000 per hour.
If these were running 24/7/365 at 20GW output that would equate to £8.8 Billion, £17.5 Billion, and £26.3 Billion respectively of value of waste heat output…….per annum.
If they were paying 8p/kwh electricity, not the 20p/kwh or more that we now pay, how much would they save?
How much tax is spent on heating NHS hospitals?
How much longer can our country afford to throw away so much useful, expensive, heat for nothing, or at least pay CCGT companies (and give them profits) to do it for us?
So many people are saying about carbon capture, but what if that 50% that is wasted is used, then there wouldn’t be half as much carbon being emitted in the first place, where we are throwing away 20GW of methane gas energy direct into the atmosphere when generating 20GW electricity with CCGT, and burning more methane separately to generate heat.
If you start to look at things like this, then HYDROGEN starts to make sense, where instead of burning at 50% efficiency in CCGT, somewhere in the middle of nowhere, small OCGTs at NHS hospitals should be sufficient, because you don’t need the extra complexity if you can actually make use of the waste heat. HYDROGEN generated by 96% efficient electrolysis, with say nominal 96% efficient usage of the energy as electricity or heat output makes perfect economic sense.
Hospitals need oxygen for treating patients, so if you electrolyse water you get oxygen and hydrogen……….free oxygen for hospitals……..oh no, BOC isn’t going to be too pleased, if hospitals start generating their own hydrogen and oxygen if electrolysis is co-located at each hospital.
There are a significant number of synergies with hospitals, power generation and electrolysis. The government and all its advisers need to have a serious think about how the future economy will be structured, especially the NHS and the power industry and part of the liquid/compressed gases industry.
Am I the only one looking at £BILLIONS of savings from synergies within the UK economy, particularly beneficial for the NHS?
And what of Drax?
Is it sensible to burn wood and waste 50% of the energy? It may be renewable fuel, but using it as inefficiently as possible isn’t very clever.
Imagine Drax attaining 50% efficiency, meaning it is burning through 6GWh of wood energy to produce just 3GWh electricity.
Even if we eventually get off gas entirely, we still can’t afford to waste energy from the renewable fuels.
A college/university/NHS hospital burning wood for electricity production may have a higher price for the electricity, is it £125/MWh for Drax instead of £80/MWh for gas? But that still gives free heat! and they would be £££££’s better off compared with the £200 per MWh that we are paying.
The regulations for gas boilers, Energy related Products (ErP) directive gave a minimum efficiency of 92%, or a SEDBUK 2009 rating of 88% (Approved Document L1).
When are the government going to apply the same standards to their own installations, and the power industry as a whole for the UK, where no electricity supplier is allowed to waste 50% of the energy from the fuels?
One can ask, why is it important? Well, even if you put the electricity through a heat pump at 300% efficiency, wasting 3GWh of wood energy means that if instead of wasting that energy it was used, it means that 1GWh of electricity would not be needed, which means that only 2GWh of electricity is needed, which means that we would only need nearer 5GWh of wood to be burnt, almost 17% improvement of fuel efficiency. If you need the 3GWh of heat and 2GWh of electricity, you could burn 5GWh of wood at 40% efficiency (electricity output). This means that using that wasted heat energy, even with heat pumps working at 300% efficiency, and power generation from wood just at 40% means that the system efficiency improves by 17%, in terms of fuel burn rate.
Can I say this loud and clear?
40%, 50% or even 60% CCGT efficiency means nothing on its own. You need to use the waste heat to reduce the burn rate of renewable fuels/gas to a minimum. Yes, it is better to put the renewable fuels through power generation, such that heat pumps can be used, such that the energy obtained from the 50% electricity production efficiency becomes 150% with a 300% heat pump CoP. But using that 50% wasted heat pushes the overall efficiency up to 200% overall, a gain of another 33%!!!
Yes, the 200% overall system efficiency turns that 17% improvement in fuel burn efficiency into double that improvement in terms of heat output efficiency!!
OK, so that covers the efficient use of fuels, but what is critical?
Capital expenditure on heat pumps or the scarcity of (limited supply/expense) of fuels?
There are some very serious conversations that need to be had. We’re wasting BILLIONS of £’s of energy value (heat) every year (in today’s money), we have been doing so ever since coal was first used in electricity production. How would you improve it?
If you are really interested, Drax only works at 38%, a long way from the >60% of CCGTs, just about 63% of the level of a CCGT.
If only there were CHP biomass solutions, smaller than the 4x645MW units at Drax, say 2MW to 20MW size, just like the sizing of the Wartsilas.
https://www.seras.co.uk/biomass-customer-locations/
https://www.eon.com/en/business-customers/success-stories/huerth.html
https://www.theecoexperts.co.uk/news/biomass-power-plant
From the Daily Mail 5th May 2022 “Public hospitals spent an average of around 15p per kWh on electricity from 2019 to 2020.
Meanwhile PFIs paid around 13 per cent less (13p per kWh) — despite the deals previously being condemned as poor value for taxpayers’ money.
PFI deals were used by ministers to bring private money and expertise into building hospitals — but have been criticised for costing the NHS more than £80billion for deals worth only £12billion.
Many ended up costing taxpayers up to five times the original cost, amid claims some hospitals were charged £333 by a PFI provider to change a lightbulb.”
So with the track record of financial mismanagement within the NHS due to Gordon Brown and the PFI initiative, is it a good idea to have the NHS managing the back-up power for not only themselves, but for the whole country?
They could have free electricity and free heating when they are generating electricity for the grid, cutting the cost of running the NHS, but would be passed onto tax-payers through electricity bills. Depending on how much profit the CCGT companies make, all that profit would effectively become extra income for the NHS/universities etc, not just the 20% tax that the CCGT companies pay to the exchequer.
Would we get better efficiency, and savings?
Some sites may not be appropriate for such development, where fuel storage and refuelling and grid connections are impractical, but are there any that would be?
What are the capital expenditure requirements, because there’d be no point if the financial gains from energy/fuel efficiency do not exceed the financial costs of changing the system (CAPEX and OPEX).
You can raise taxes, go for growth or, like many businesses, look at what competitors or suppliers are doing and see if you can do what they are doing more efficiently and bring new products/services in house.
The 20MW Wartsila engines without ancillaries are 14m x 5m x 5m.
Choose your fuel, diesel, methanol, LNG, HFO, LBF, LFO.
https://brandhub.wartsila.com/m/4cc137ea2fc5bf0b/original/Wartsila-46F-Leaflet.pdf?utm_source=engines&utm_medium=dualfuelengines&utm_term=w46f&utm_content=brochure&utm_campaign=mp-engines-and-generating-sets-brochures
Wartsila even have hydrogen ready engines
https://www.current-news.co.uk/wartsila-launches-worlds-first-100-hydrogen-ready-power-plant/
(June 19th 2024)
and
https://www.current-news.co.uk/centrica-completes-20mw-hydrogen-blend-peaker-plant/
Wartsila engines, 100,000 to 200,000 hours lifespan, between 11.5 years and 23 years if running 24/7/365……intermittent usage………, say equivalent of 2 months per annum…….69 to 138 years.
I’m not a sales rep for Wartsila.
There is another alternative, you tell every company, school, hospital, university etc etc to invest in CHP, and then when the wind doesn’t blow and the sun doesn’t shine, you tell them to switch over to their own CHP, i.e. you expect all large users of electricity to have their own back-up (go off-grid), significantly reducing the demand on the grid and will have nominal >90% efficiency. Perhaps then we wouldn’t need any CCGT or a replacement for it at all…….just a thought.
Thank you for the time and effort you put into this. I am confident that there are increasing numbers of people that put a high value on your work.